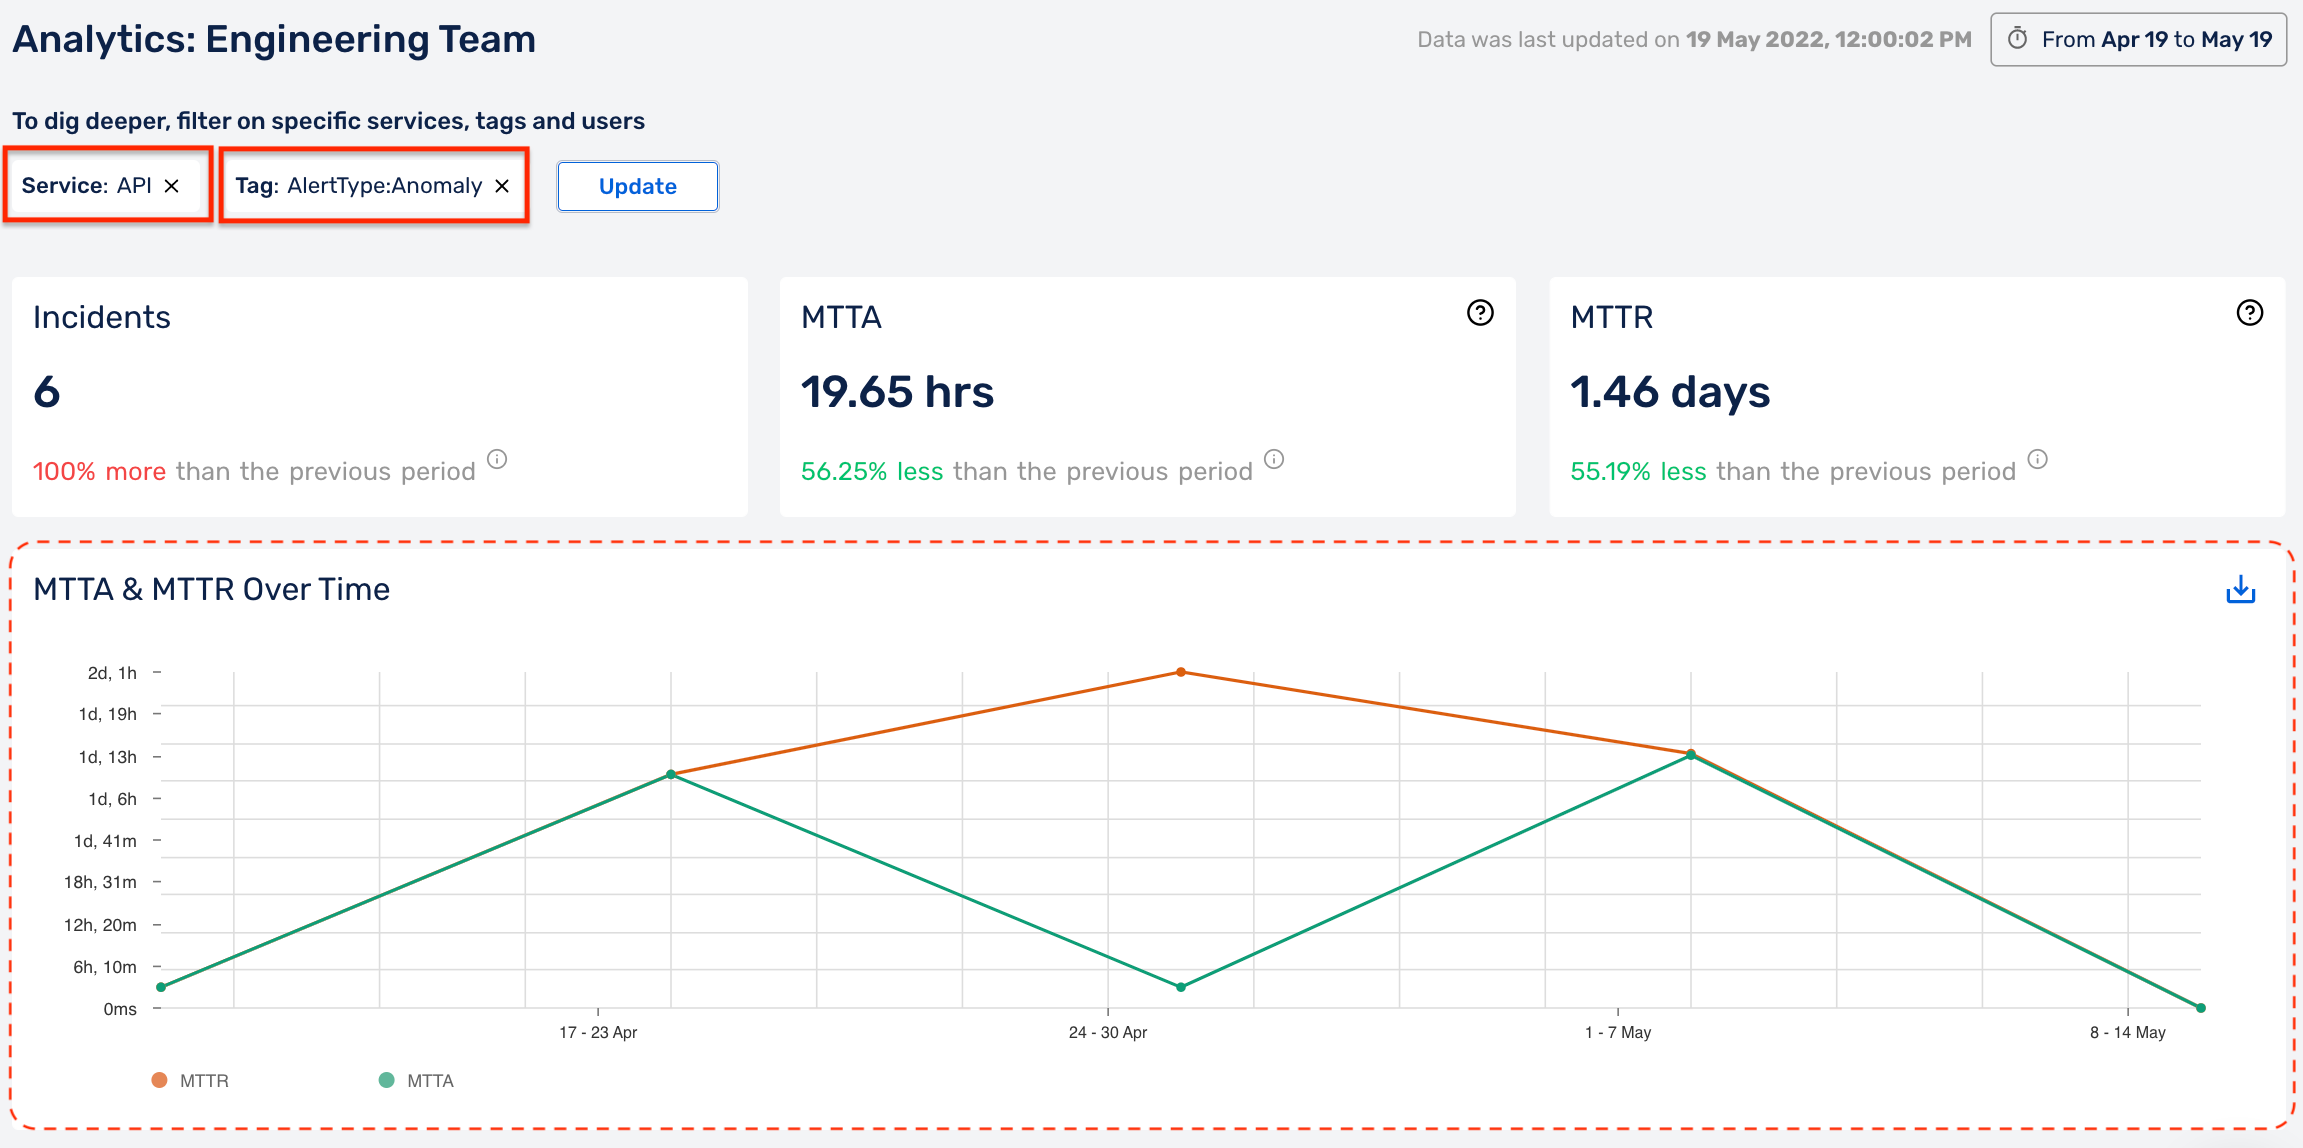
Analytics
The Analytics Dashboard helps you analyze the performance of your Organization/ Team, for a given time period.
Note:
Only users with Org Level Permission can view Organization Analytics.
Team Level Analytics
Note:
Team Level Analytics uses Role-Based Access Control. Only the users who are part of the Team can view that Team’s performance.
Select the appropriate Team from the Team picker on the top left.
- Click on Analytics in the sidebar
- By default, the selected time range is the last 30 days
You can select a custom time range using the utility on the top right corner of the page, to select and apply a time range for Analytics data consumption.
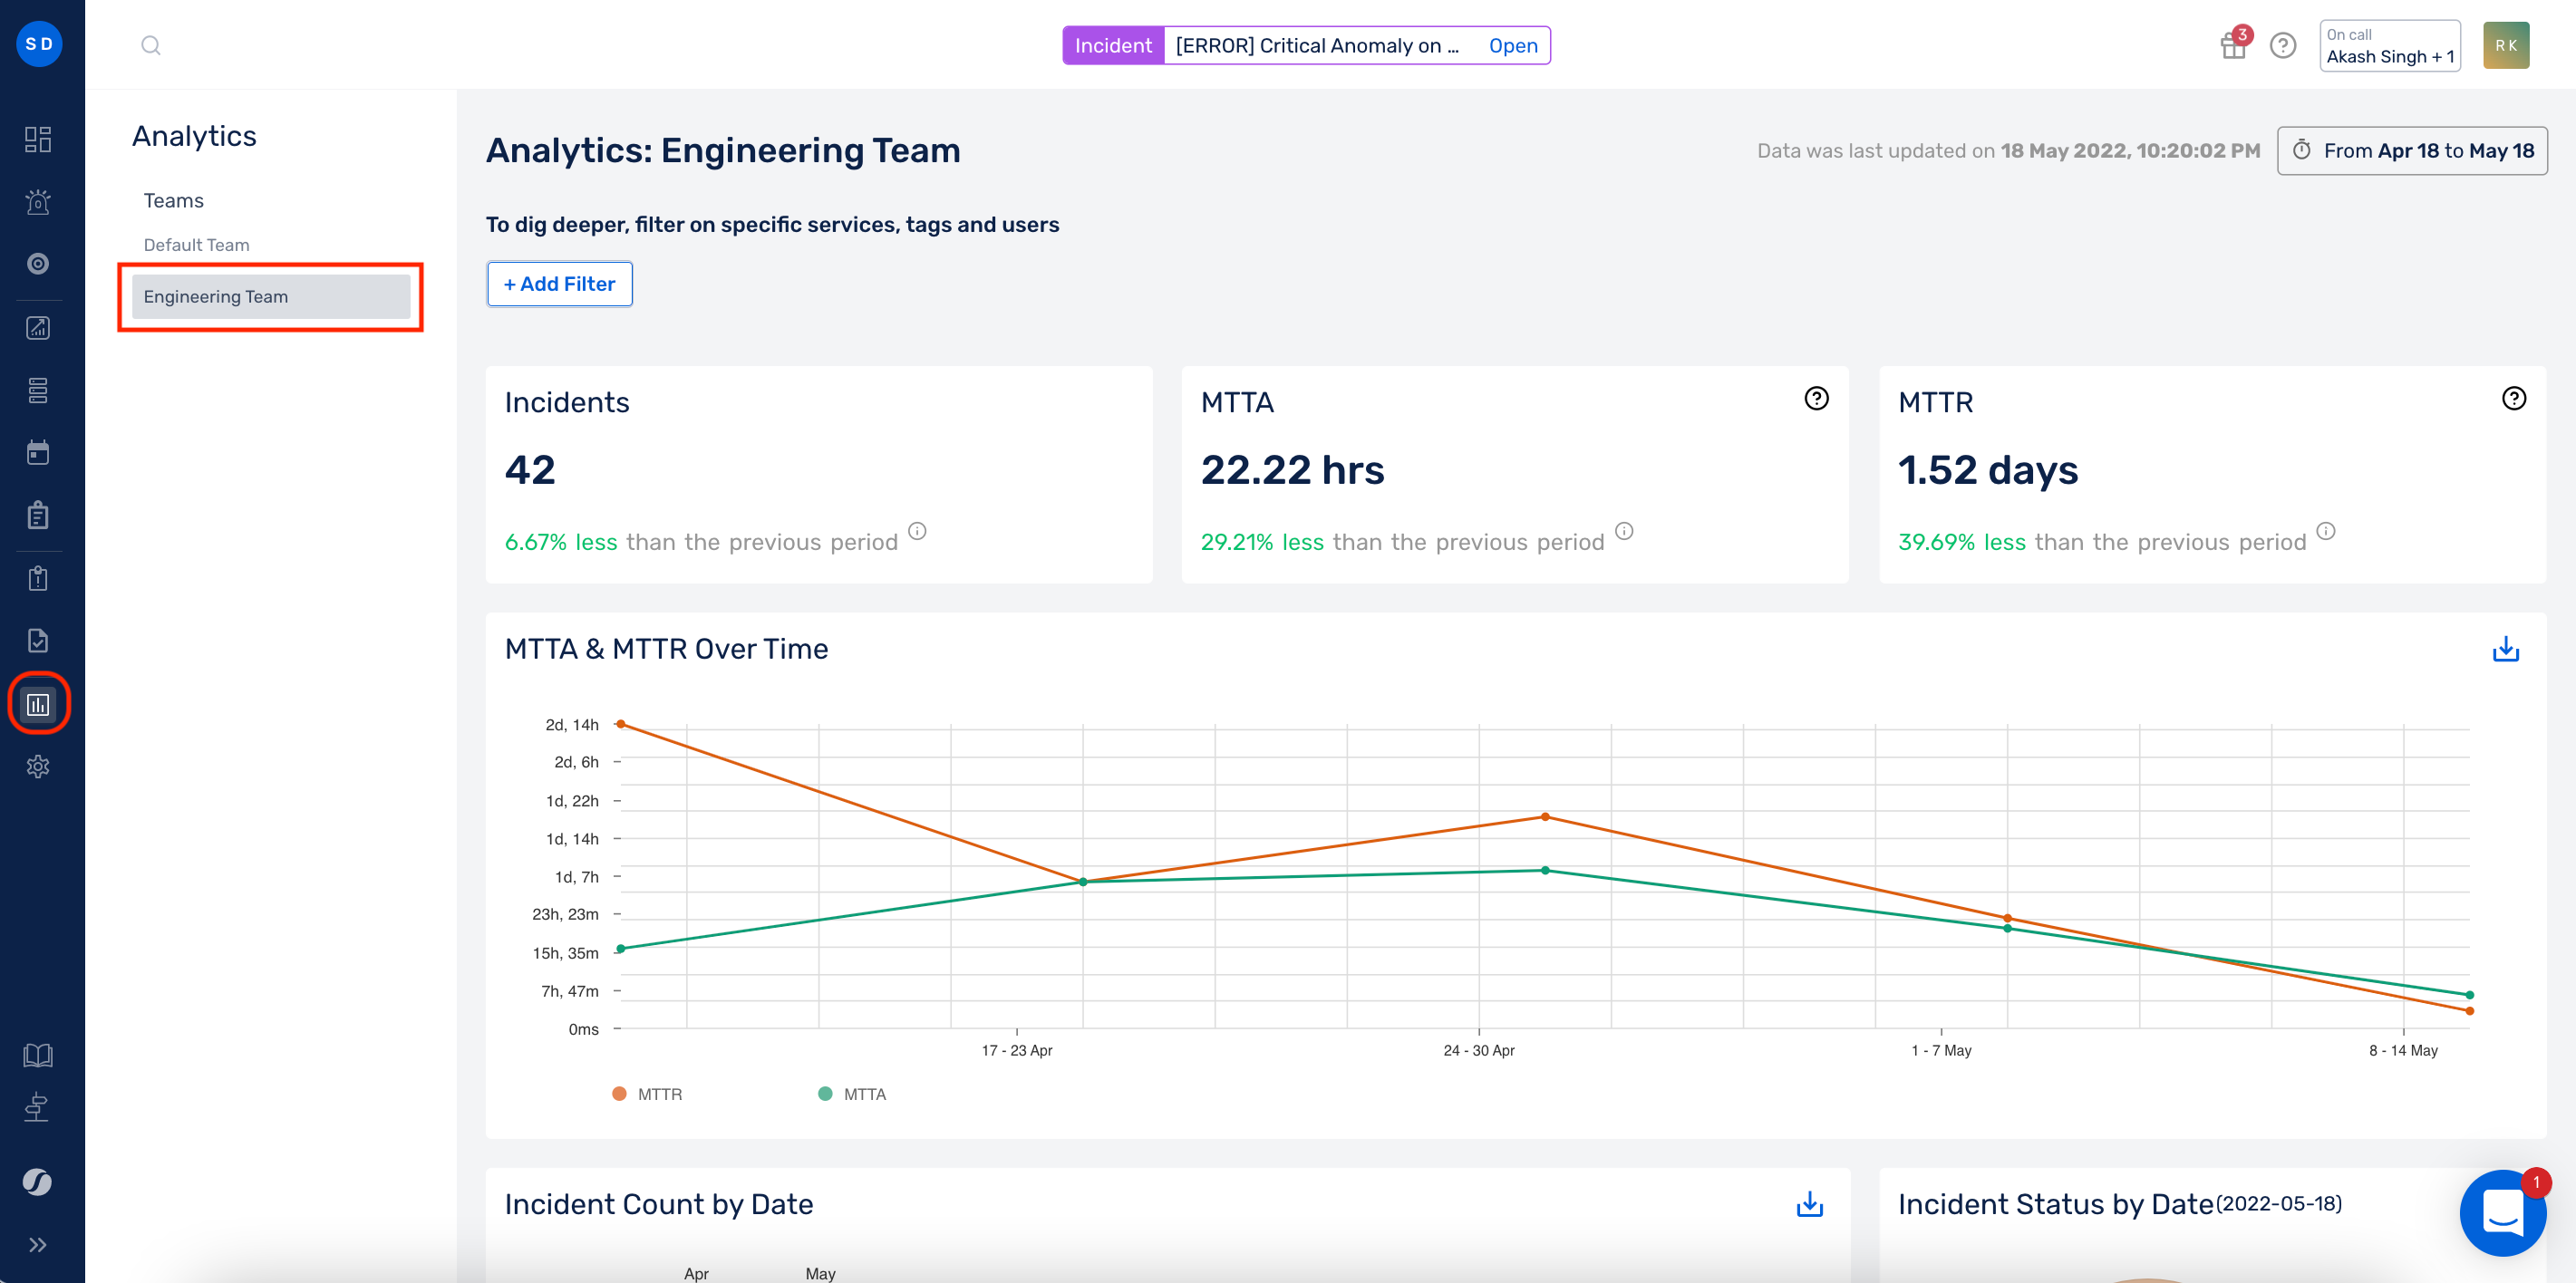
In Team Analytics, you can see many components:
Note:
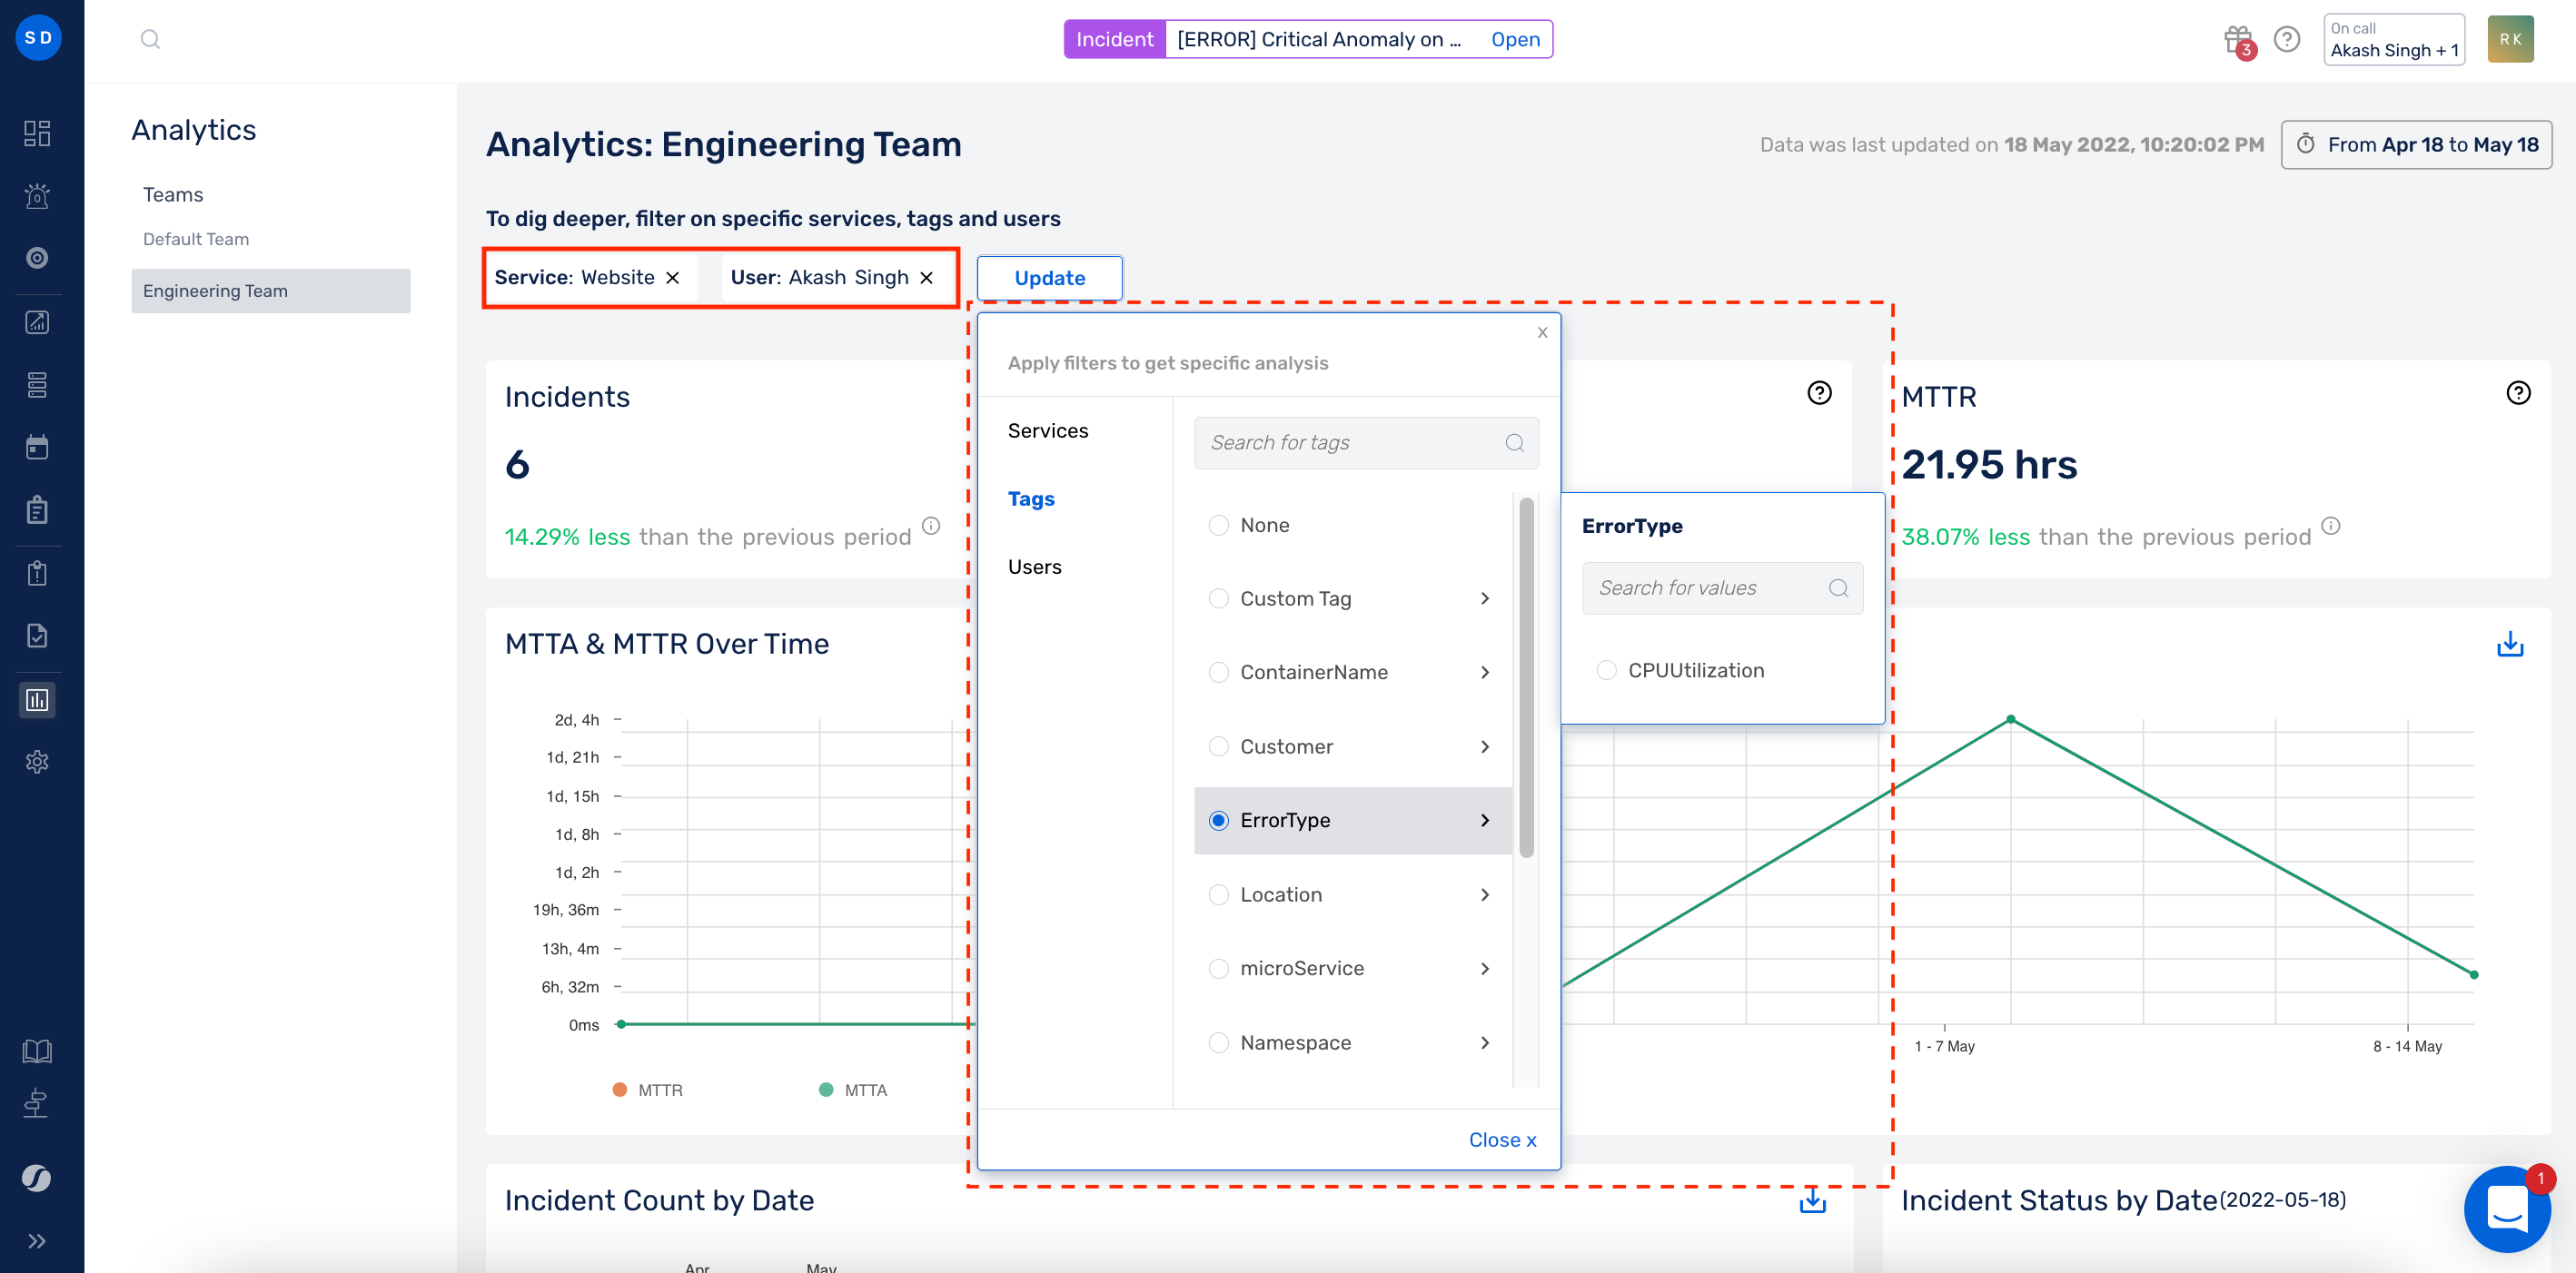
You can filter Team Analytics based on Services, Tags and Users. Click on +Add Filter -> Select the Service, Tag or User -> Click on Close
Note:
You can only select one Service, Tag and User at a time. Multiselect for any one category is not permitted today.
Note:
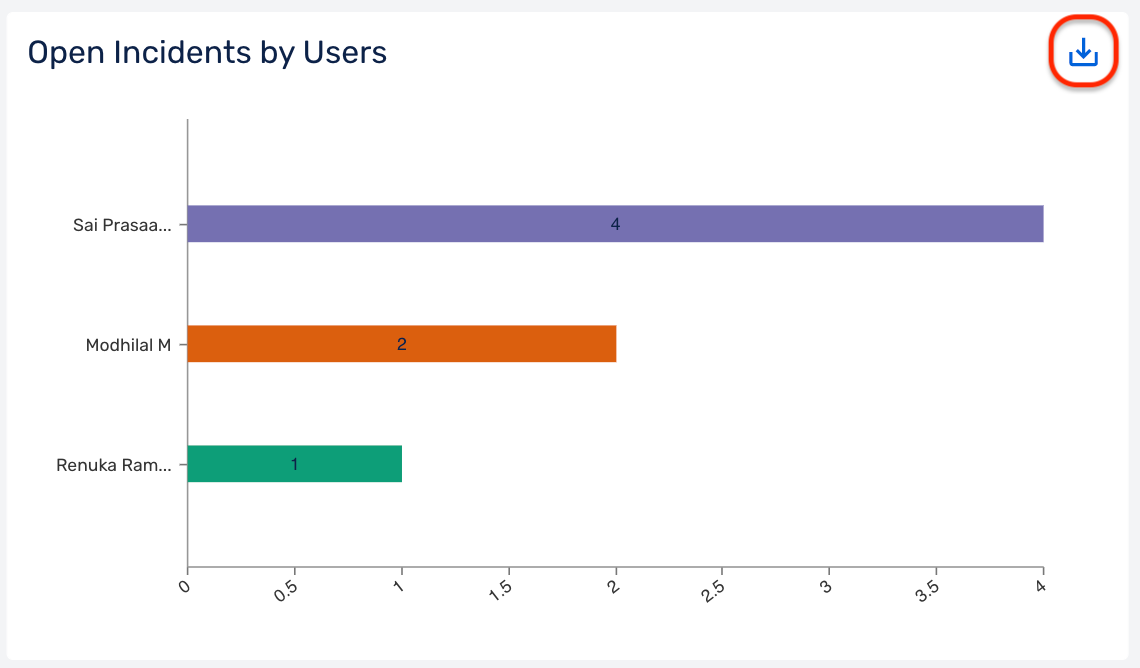
You can export .csv files for each graph. To do so, use the download icon on the top right of each graph.
Organization Level Analytics
Note:
To view the Organization Level Analytics, you need to have the Org Level Analytics Permission.
A user with Org Level Analytics can view the performance of the entire Organization, irrespective of whether you’re a part of a specific team. Organization Analytics Permission gives you the ability to access analytics for all the teams as a collective, but not individual team analytics for the teams they are not a part of.
To view Organization Level Analytics, select the appropriate Organization from the top left corner of your screen.
- Click on Analytics in the sidebar
- By default, the selected time range is the last 30 days
You can select a custom time range using the utility on the top right corner of the page, to select and apply a time range for Analytics data consumption.
In Organization Analytics, you can see many components:
| Component | Description |
|---|---|
| Incidents | Total incident count of the Organization |
| MTTA | Mean Time to Acknowledge shows the average amount of time between a system alert and a team member acknowledging it, for the entire Organization, over a specified period of time |
| MTTR | Mean Time to Resolution shows the average amount of time it takes to respond to or resolve an incident, for the entire Organization, over a specified period of time |
| MTTA & MTTR over time | 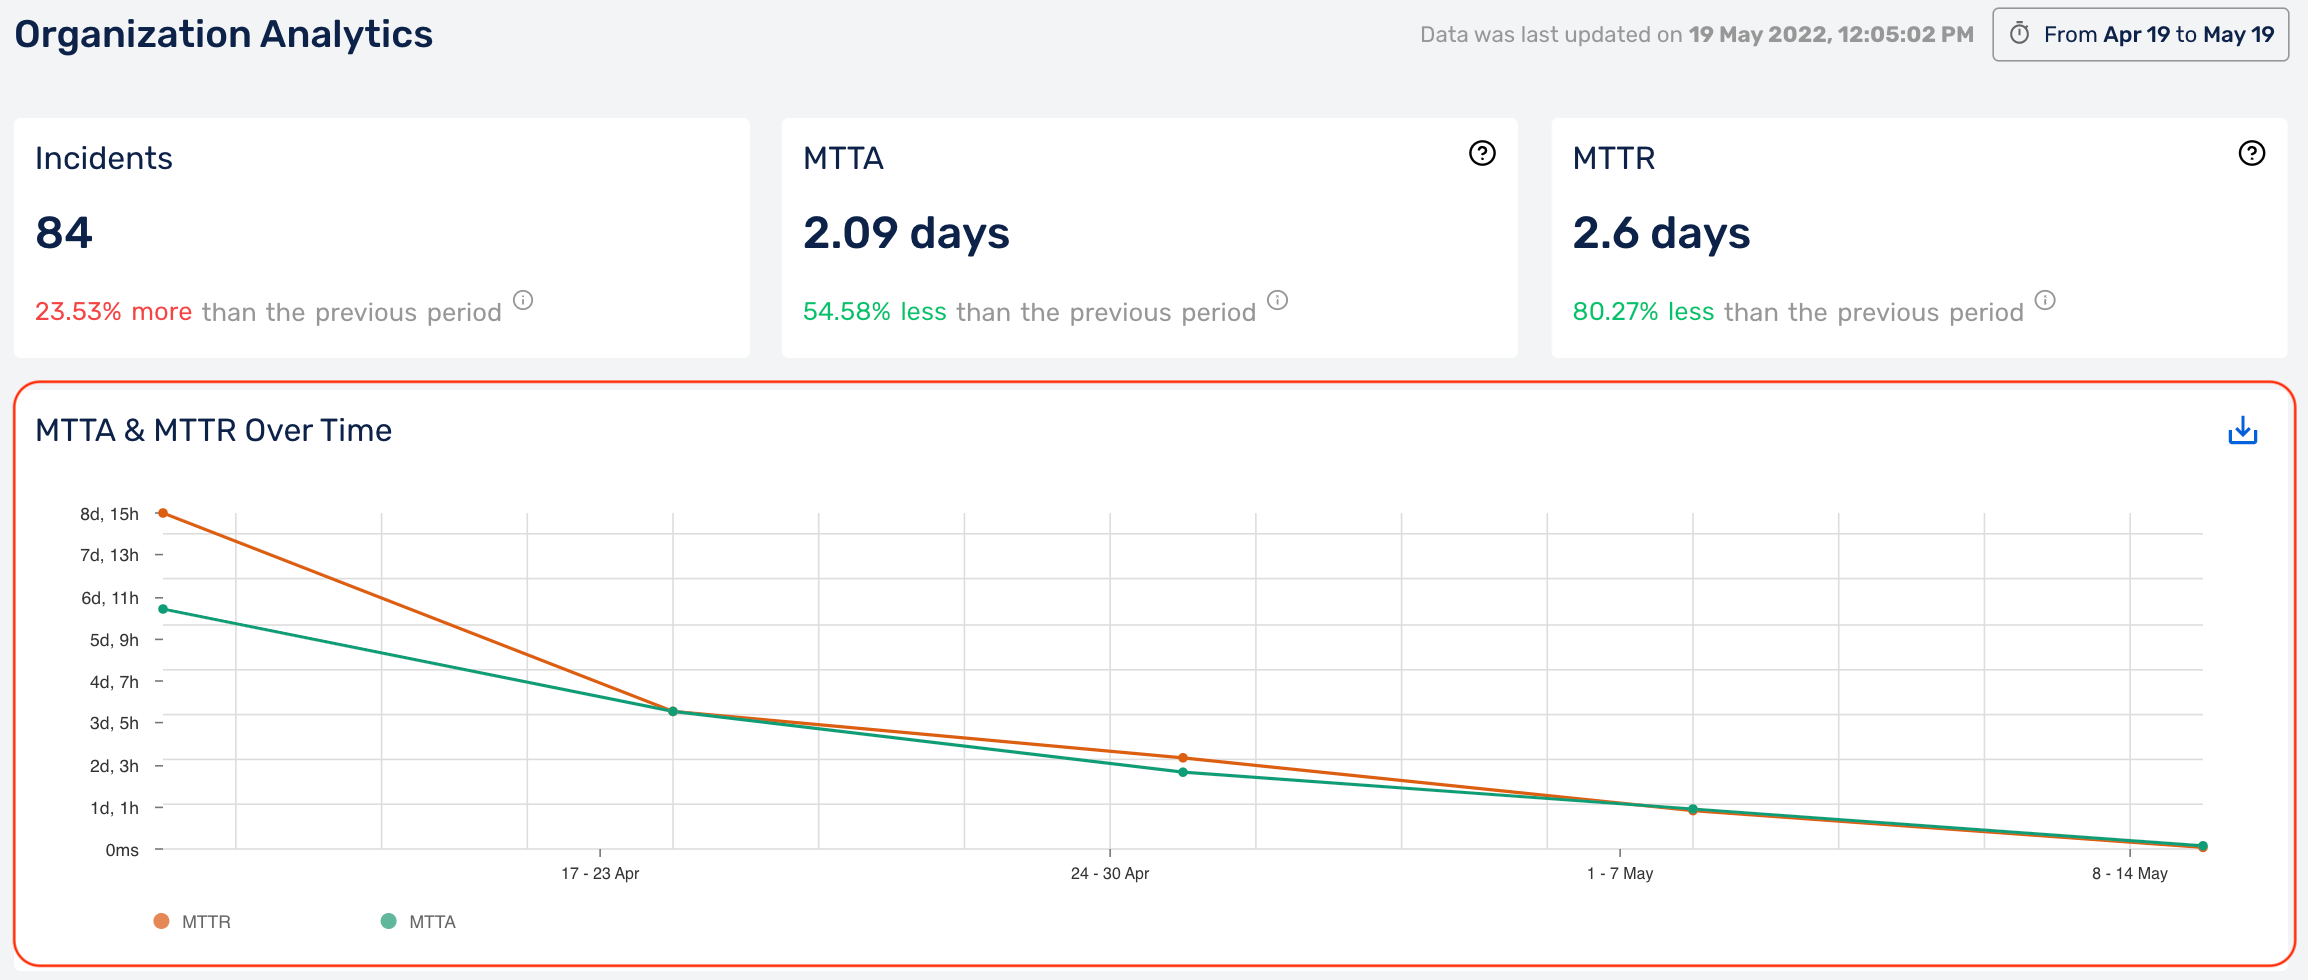 |
| Open Incidents by Team | Team level split of total number of open incidents |
| Deduplicated Incidents by Team | Team level split of total number of deduplicated incidents |
| Suppressed Incidents by Team | Team level split of total number of suppressed incidents |
Note:
You cannot filter Organization Analytics based on teams, you need access to a team, to view their performance data.
Note:
You can export .csv files for each graph. To do so, use the download icon on the top right of each graph.

FAQs
Please refer to the Frequently Asked Questions below that might help you fix any issues/answer your queries.
1. What permission do I need to view Organization Analytics?
You need to have the Organization Analytics Permission to view the Organization Analytics Dashboard.
2. Can I view any Team’s performance if I have the Organization Analytics permission?
Organization Analytics Permission gives you the ability to access analytics for all the teams as a collective, but not individual team analytics for the teams they are not a part of.
3. Can I select multiple Services, Tags or Users to filter out Team’s performance?
No, multiselect is not permitted for any Service, Tags or Users filter today. You can only select one of each, at a time.
4. Can I select Service, Tags and Users together to filter out Team’s performance?
Yes, you can select one of each, Services, Tags and Users together to filter out Team’s performance.
5. Do I need to be a part of the Team to view their Team Analytics Dashboard?
Yes, you need to be a part of a Team to view their individual Team Analytics Dashboard.
