Kibana
This document will help you integrate Kibana with Squadcast.
Kibana is a free and open user interface that lets you visualize your Elasticsearch data and navigate the Elastic Stack.
Route detailed alerts from Kibana to the right users in Squadcast.
How to integrate Kibana with Squadcast
In Squadcast: Using Kibana as an Alert Source
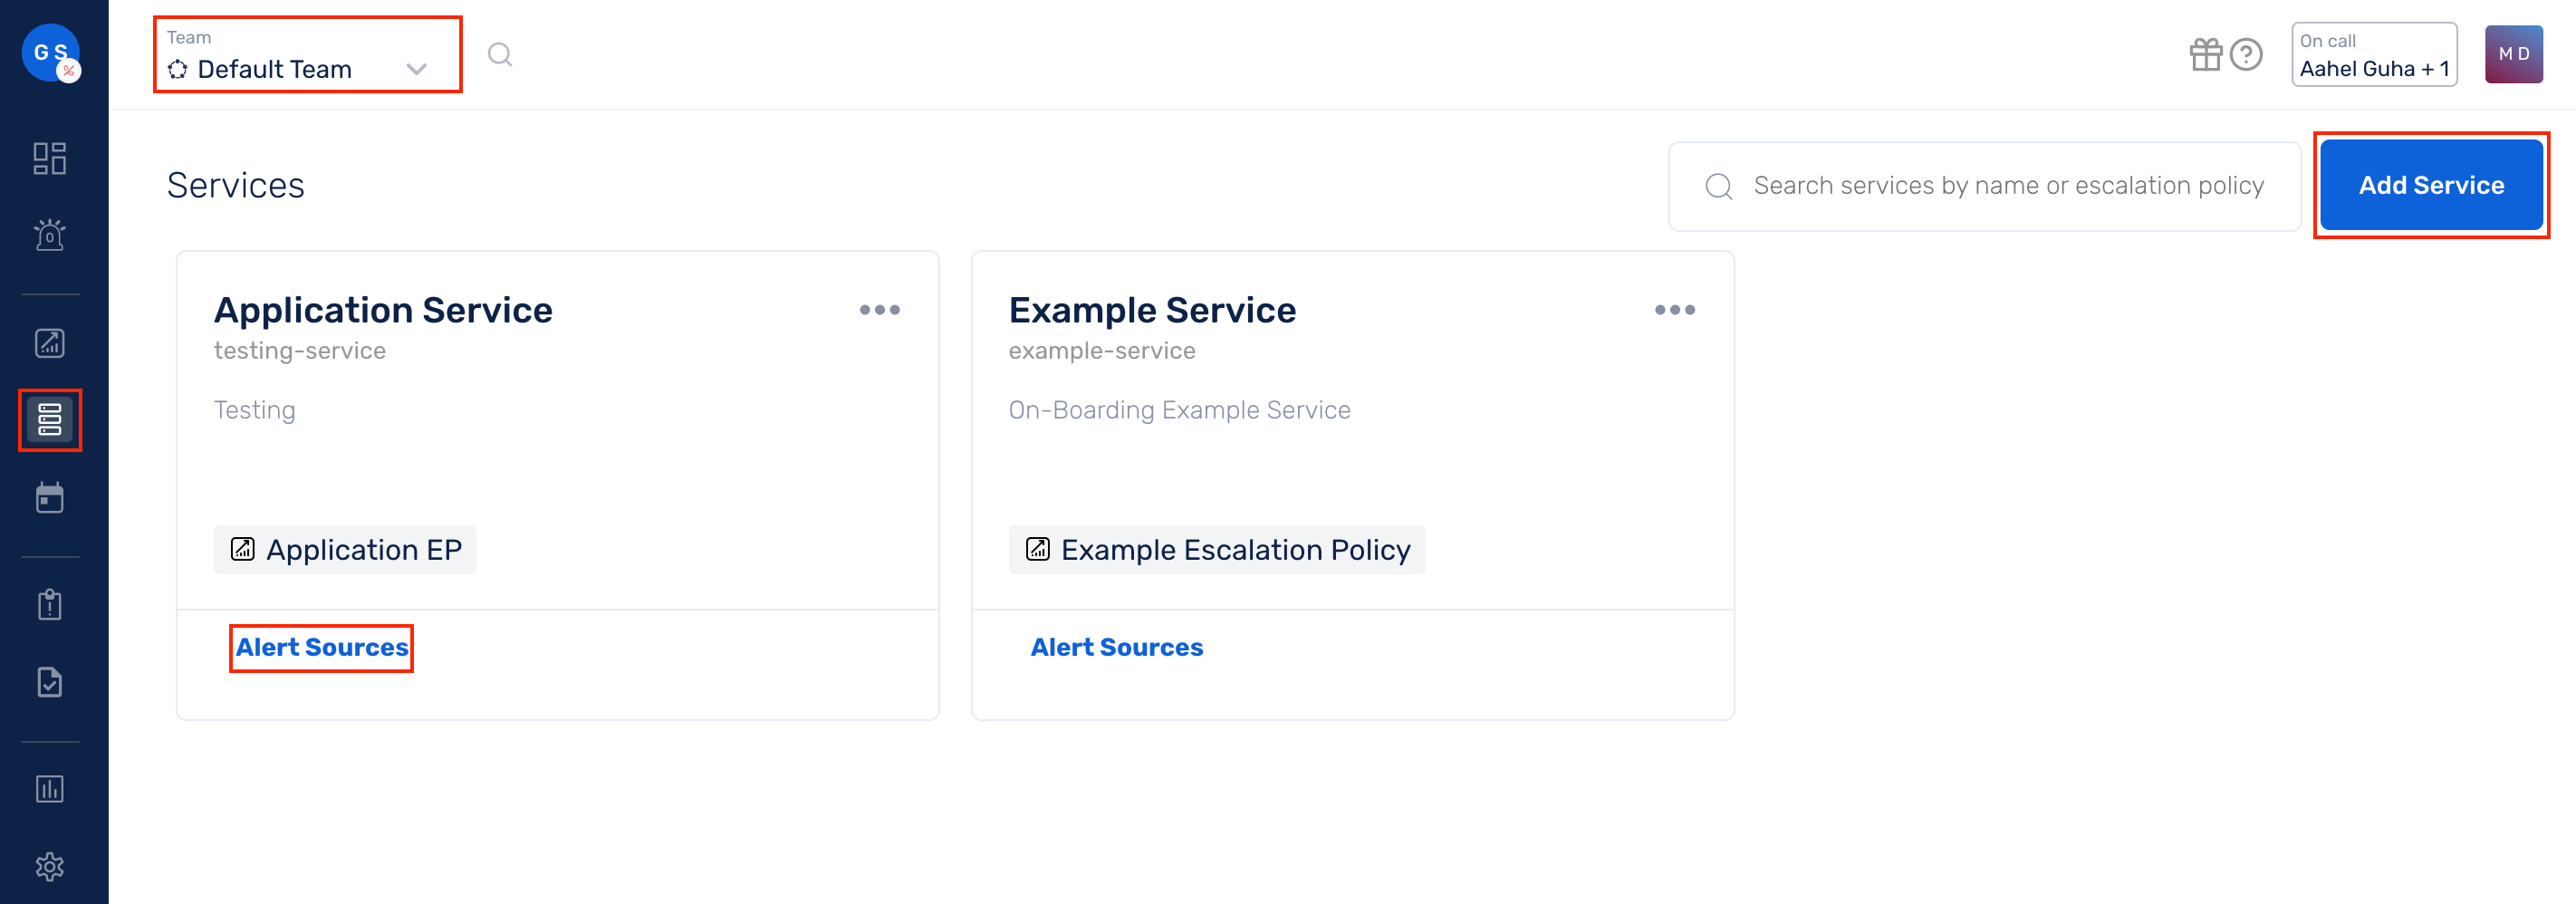
(1) From the navigation bar on the left, select Services. Pick the applicable Team from the Team-picker on the top. Next, click on Alert Sources for the applicable Service
(2) Search for Kibana from the Alert Source drop-down and copy the Webhook URL
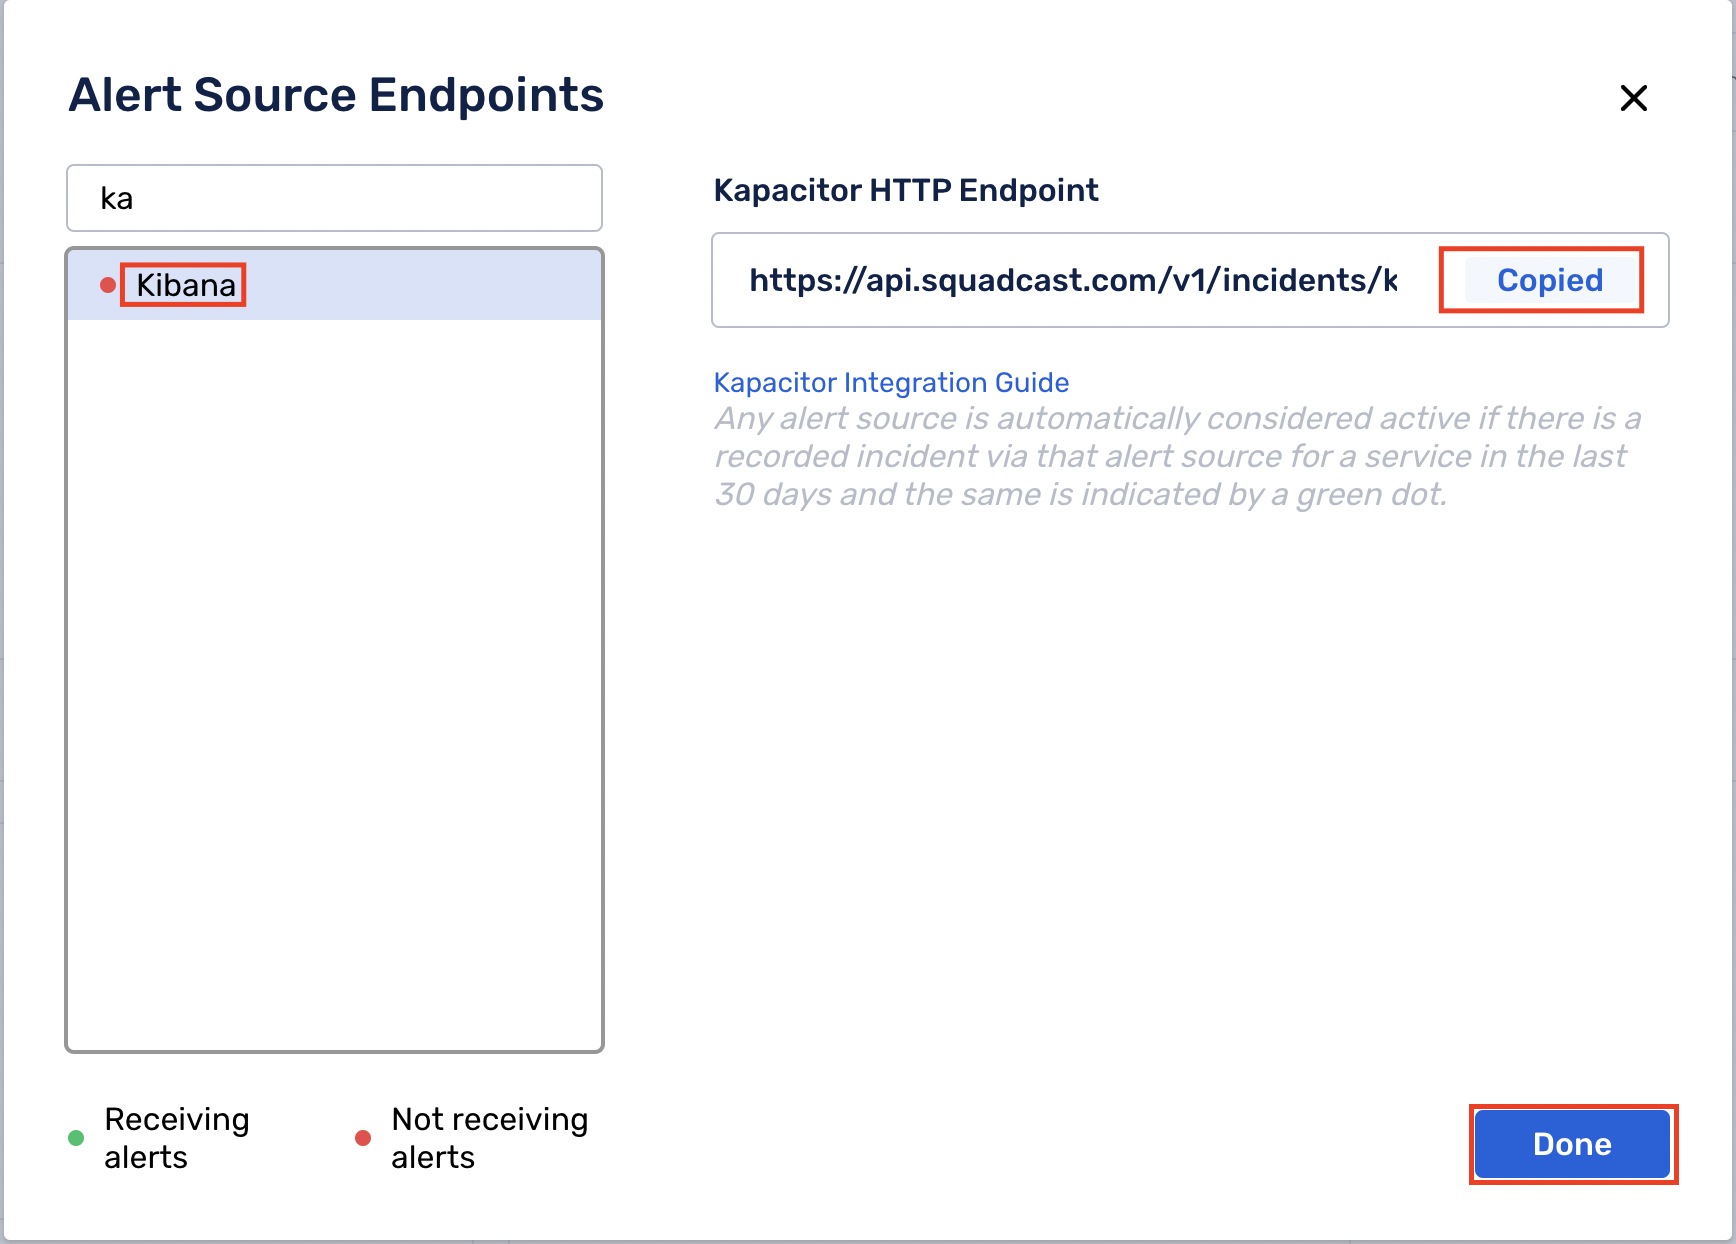
For an Alert Source to turn active (indicated by a green dot - Receiving alerts against the name of the Alert Source in the drop-down), you can either generate a test alert or wait for a real-time alert to be generated by the Alert Source.
An Alert Source is active if there is a recorded incident via that Alert Source for the Service in the last 30 days.
In Kibana: Create a Squadcast webhook alert
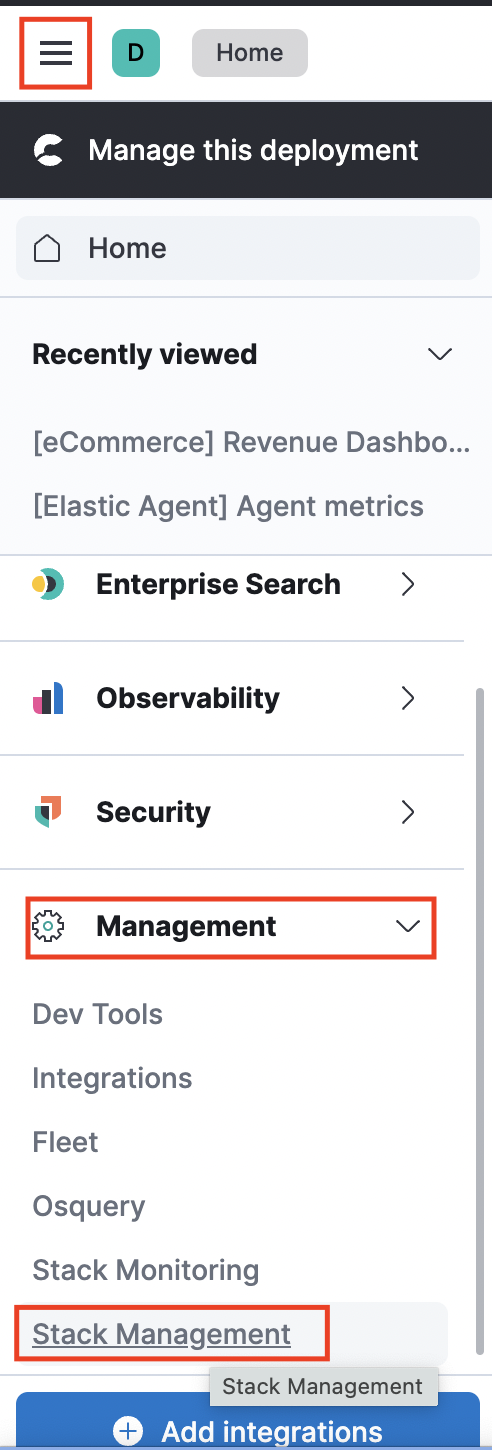
(1) From the navigation bar on the left, select Management and then, select Stack Management
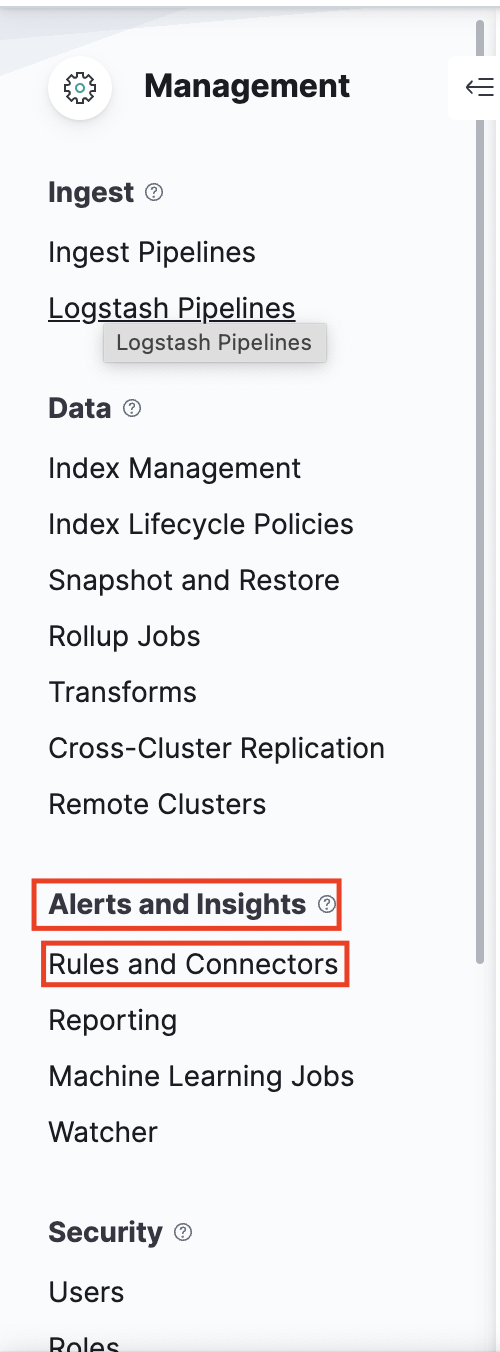
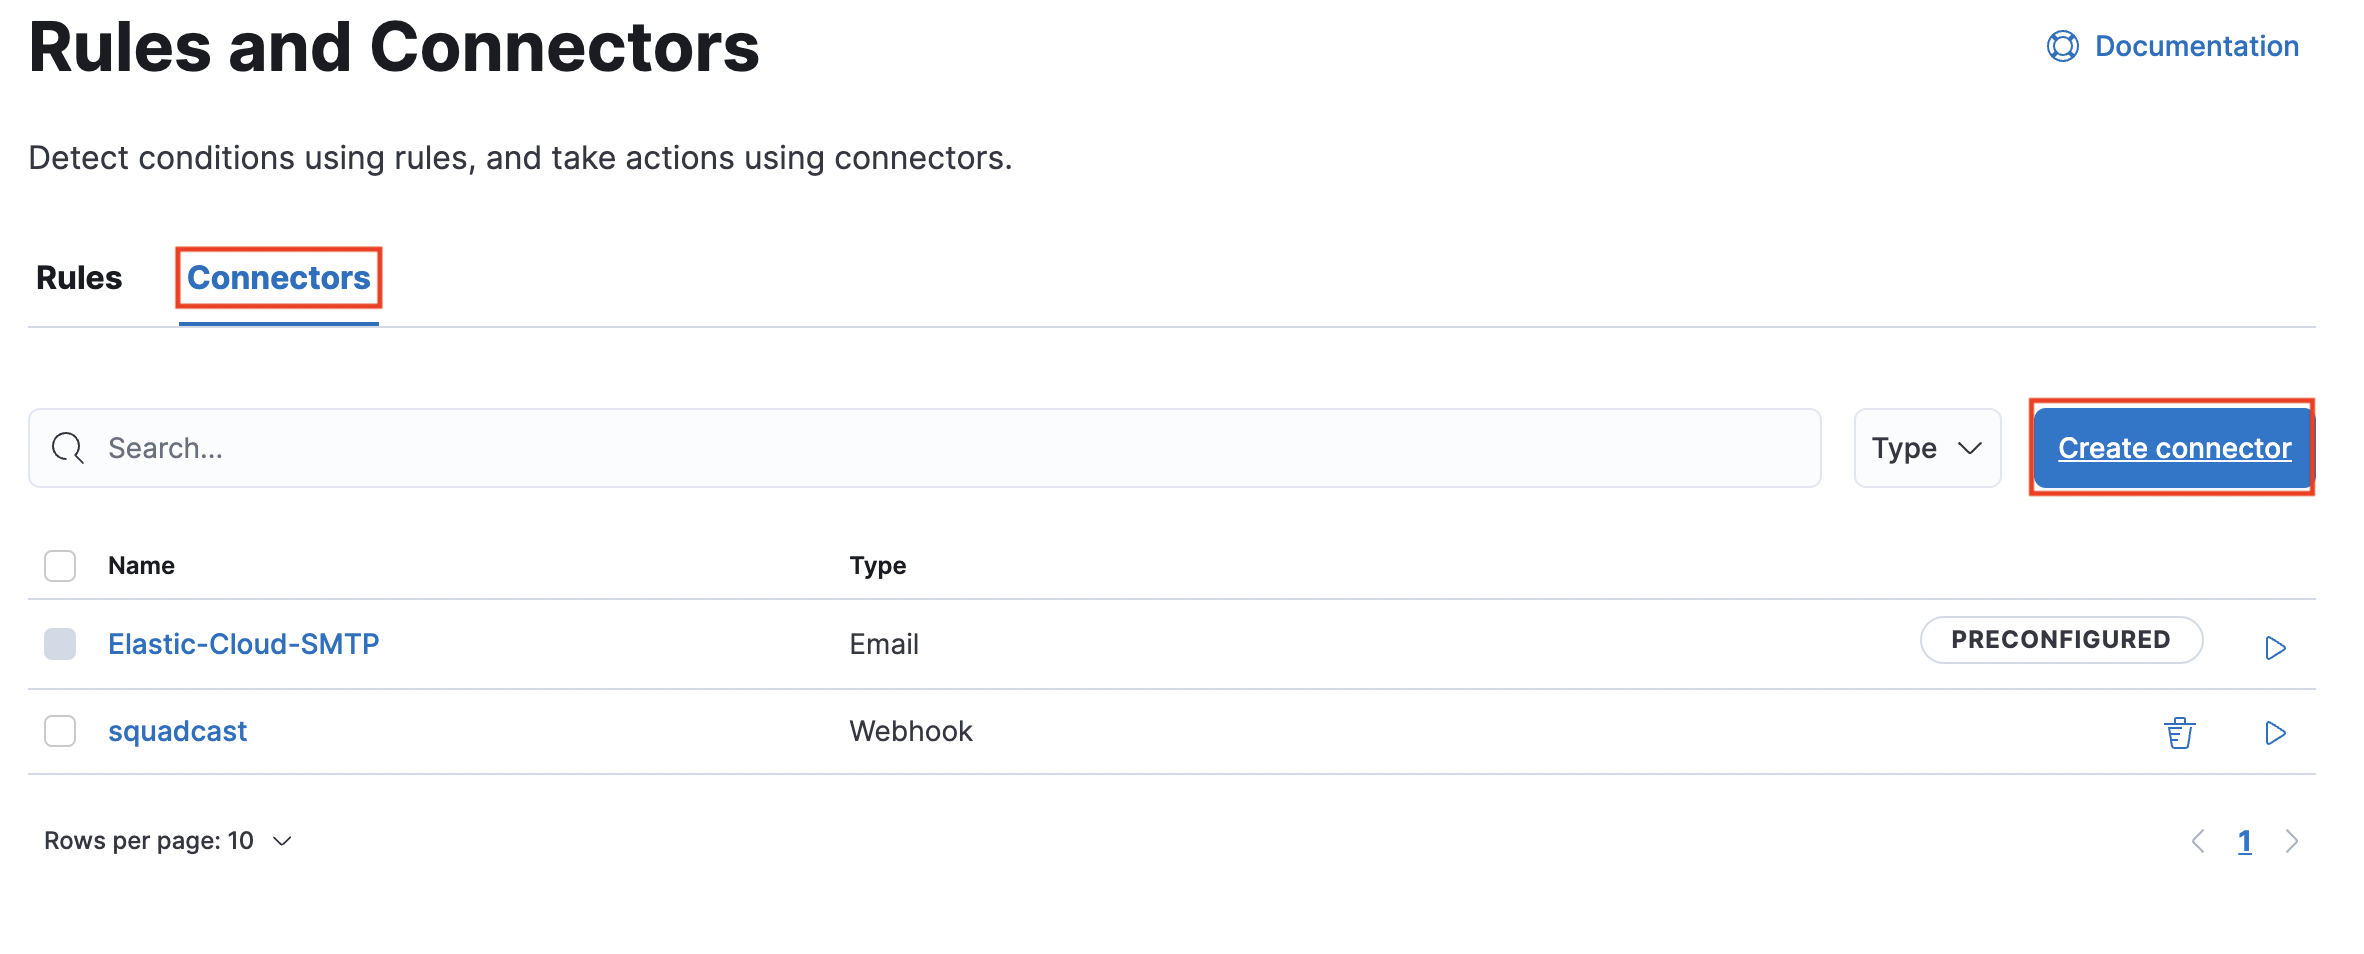
(2) Select Alerts and Insights > Rules and Connectors
(3) Navigate to Connectors and click on Create Connector
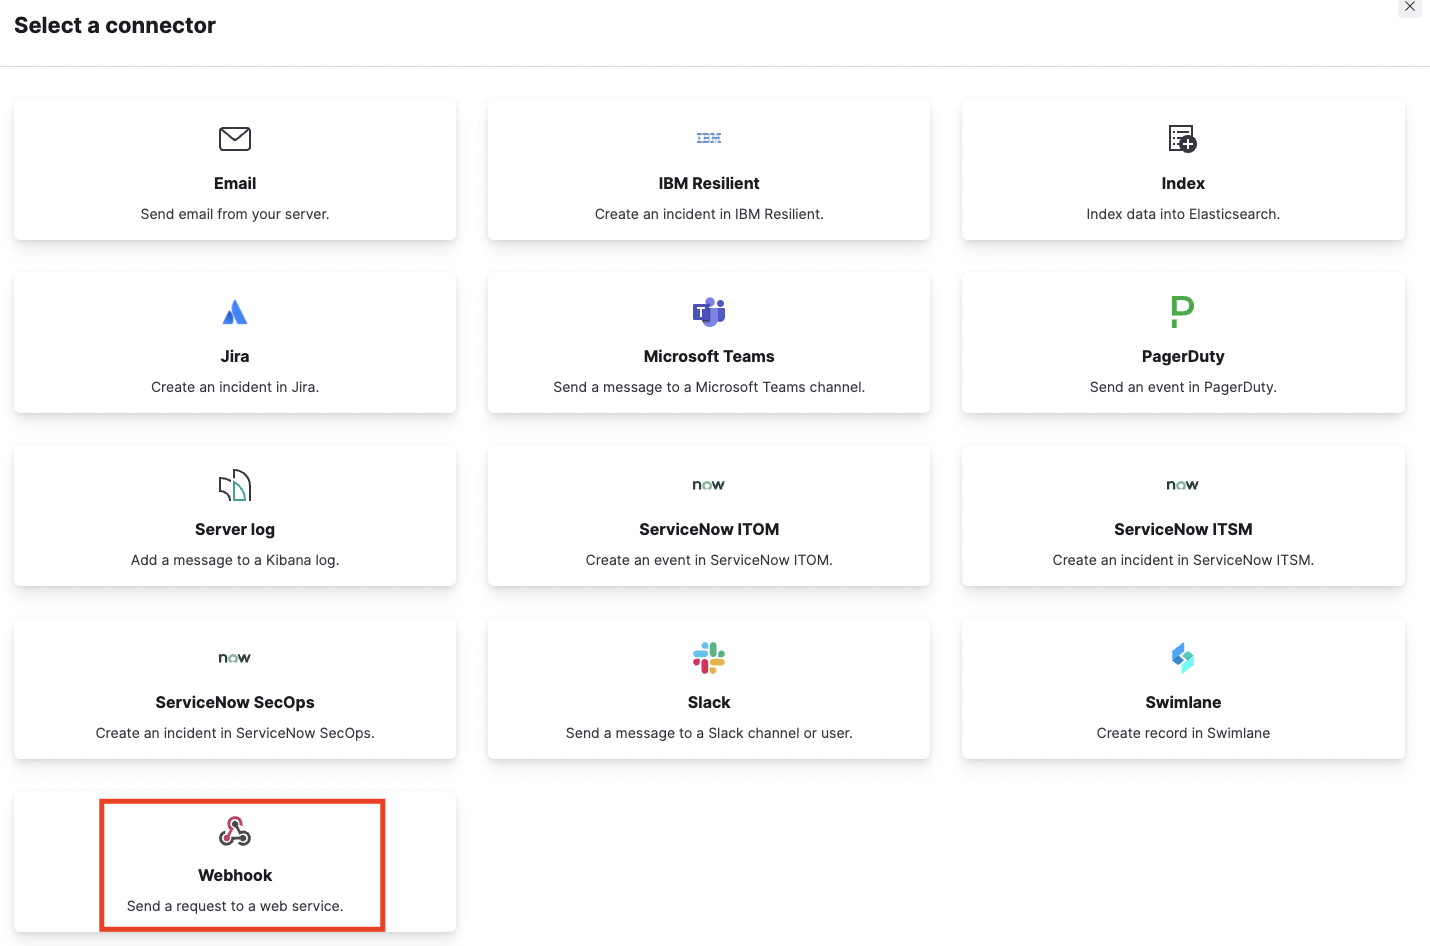
(4) Select Webhook as a Connector
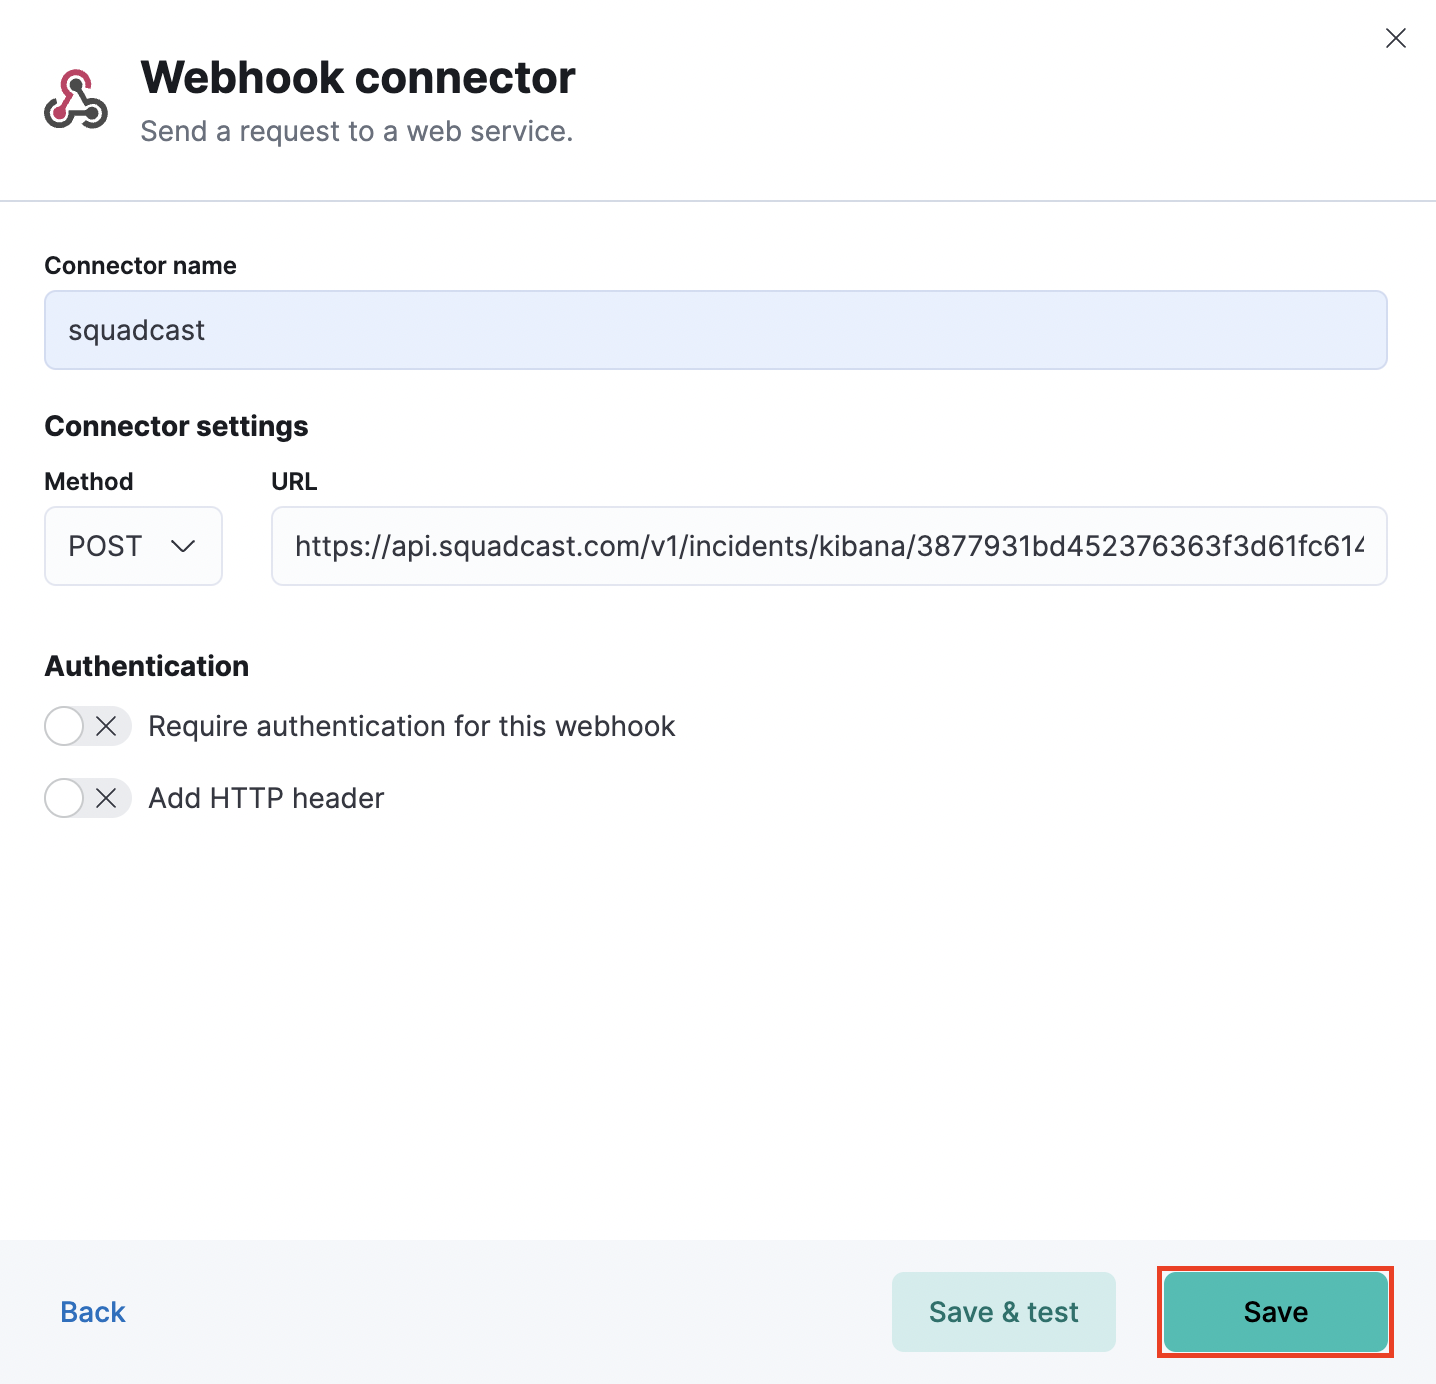
(5) Provide a name for Connector name, choose Method as POST and paste the previously copied Squadcast Webhook URL in the URL field. Click on Save
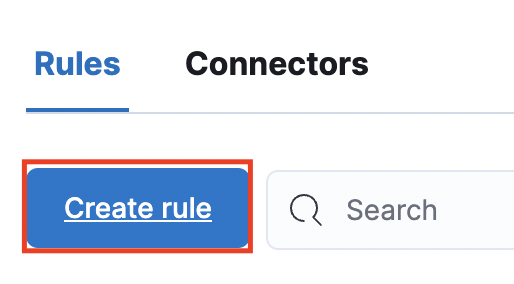
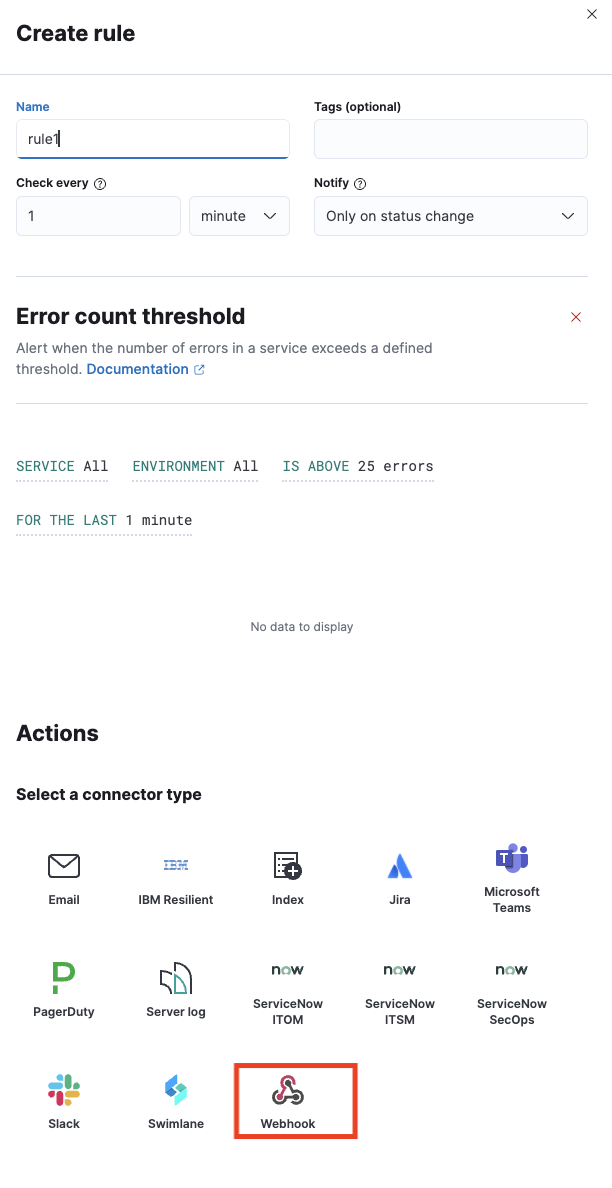
(6) Head over to Rules and click on Create Rules. Provide a name for the rule and select any of the options from the supported rule scenarios: (a) APM AND USER EXPERIENCE (b) LOGS (c) MACHINE LEARNING (d) METRICS (e) UPTIME
Select Webhook in the Action section.
(7) Next, select the previously created Connector in the Webhook connector drop-down and paste the below JSON in the placeholder for Body and click on Save
{
    "actionGroupName": "{{alert.actionGroupName}}",
    "actionSubgroup": "{{alert.actionSubgroup}}",
    "alert_id": "{{alert.id}}",
    "actionGroup": "{{alert.actionGroup}}",
    "conditions": "{{context.conditions}}",
    "denominatorConditions": "{{context.denominatorConditions}}",
    "group": "{{context.group}}",
    "isRatio": "{{context.isRatio}}",
    "matchingDocuments": "{{context.matchingDocuments}}",
    "numeratorConditions": "{{context.numeratorConditions}}",
    "ratio": "{{context.ratio}}",
    "timestamp": "{{context.timestamp}}",
    "date": "{{date}}",
    "kibanaBaseUrl": "{{kibanaBaseUrl}}",
    "rule_id": "{{rule.id}}",
    "name": "{{rule.name}}",
    "spaceId": "{{rule.spaceId}}",
    "tags": "{{rule.tags}}",
    "type": "{{rule.type}}",
    "environment": "{{context.environment}}",
    "serviceName": "{{context.serviceName}}",
    "threshold": "{{context.threshold}}",
    "transactionType": "{{context.transactionType}}",
    "triggerValue": "{{context.triggerValue}}",
    "interval": "{{context.interval}}",
    "isInterim": "{{context.isInterim}}",
    "jobIds": "{{context.jobIds}}",
    "message": "{{context.message}}",
    "score": "{{context.score}}",
    "topInfluencers": "{{context.topInfluencers}}",
    "topRecords": "{{context.topRecords}}",
    "anomalyExplorerUrl": "{{context.anomalyExplorerUrl}}",
    "timestampIso8601": "{{context.timestampIso8601}}",
    "results": "{{context.results}}",
    "metric": "{{context.metric}}",
    "reason": "{{context.reason}}",
    "value": "{{context.value}}",
    "alertState": "{{context.alertState}}",
    "currentTriggerStarted": "{{state.currentTriggerStarted}}",
    "firstCheckedAt": "{{state.firstCheckedAt}}",
    "firstTriggeredAt": "{{state.firstTriggeredAt}}",
    "isTriggered": "{{state.isTriggered}}",
    "lastCheckedAt": "{{state.lastCheckedAt}}",
    "lastResolvedAt": "{{state.lastResolvedAt}}",
    "lastTriggeredAt": "{{state.lastTriggeredAt}}",
    "latestErrorMessage": "{{state.latestErrorMessage}}",
    "monitorId": "{{state.monitorId}}",
    "monitorName": "{{state.monitorName}}",
    "monitorType": "{{state.monitorType}}",
    "monitorUrl": "{{state.monitorUrl}}",
    "observerHostname": "{{state.observerHostname}}",
    "observerLocation": "{{state.observerLocation}}",
    "statusMessage": "{{state.statusMessage}}",
    "downMonitorsWithGeo": "{{context.downMonitorsWithGeo}}",
    "agingCommonNameAndDate": "{{state.agingCommonNameAndDate}}",
    "agingCount": "{{state.agingCount}}",
    "count": "{{state.count}}",
    "expiringCommonNameAndDate": "{{state.expiringCommonNameAndDate}}",
    "expiringCount": "{{state.expiringCount}}"
}

That is it, you are now good to go! Whenever an alert is generated in Kibana, an incident will be created in Squadcast.
For any queries, please reach out to our Support team and they will be happy to assist you with your Kibana queries.