Dashboard Metrics
Squadcast dashboard is the first screen that your Web App and Mobile App open into. This document will guide you through how these metrics are calculated and what they mean.
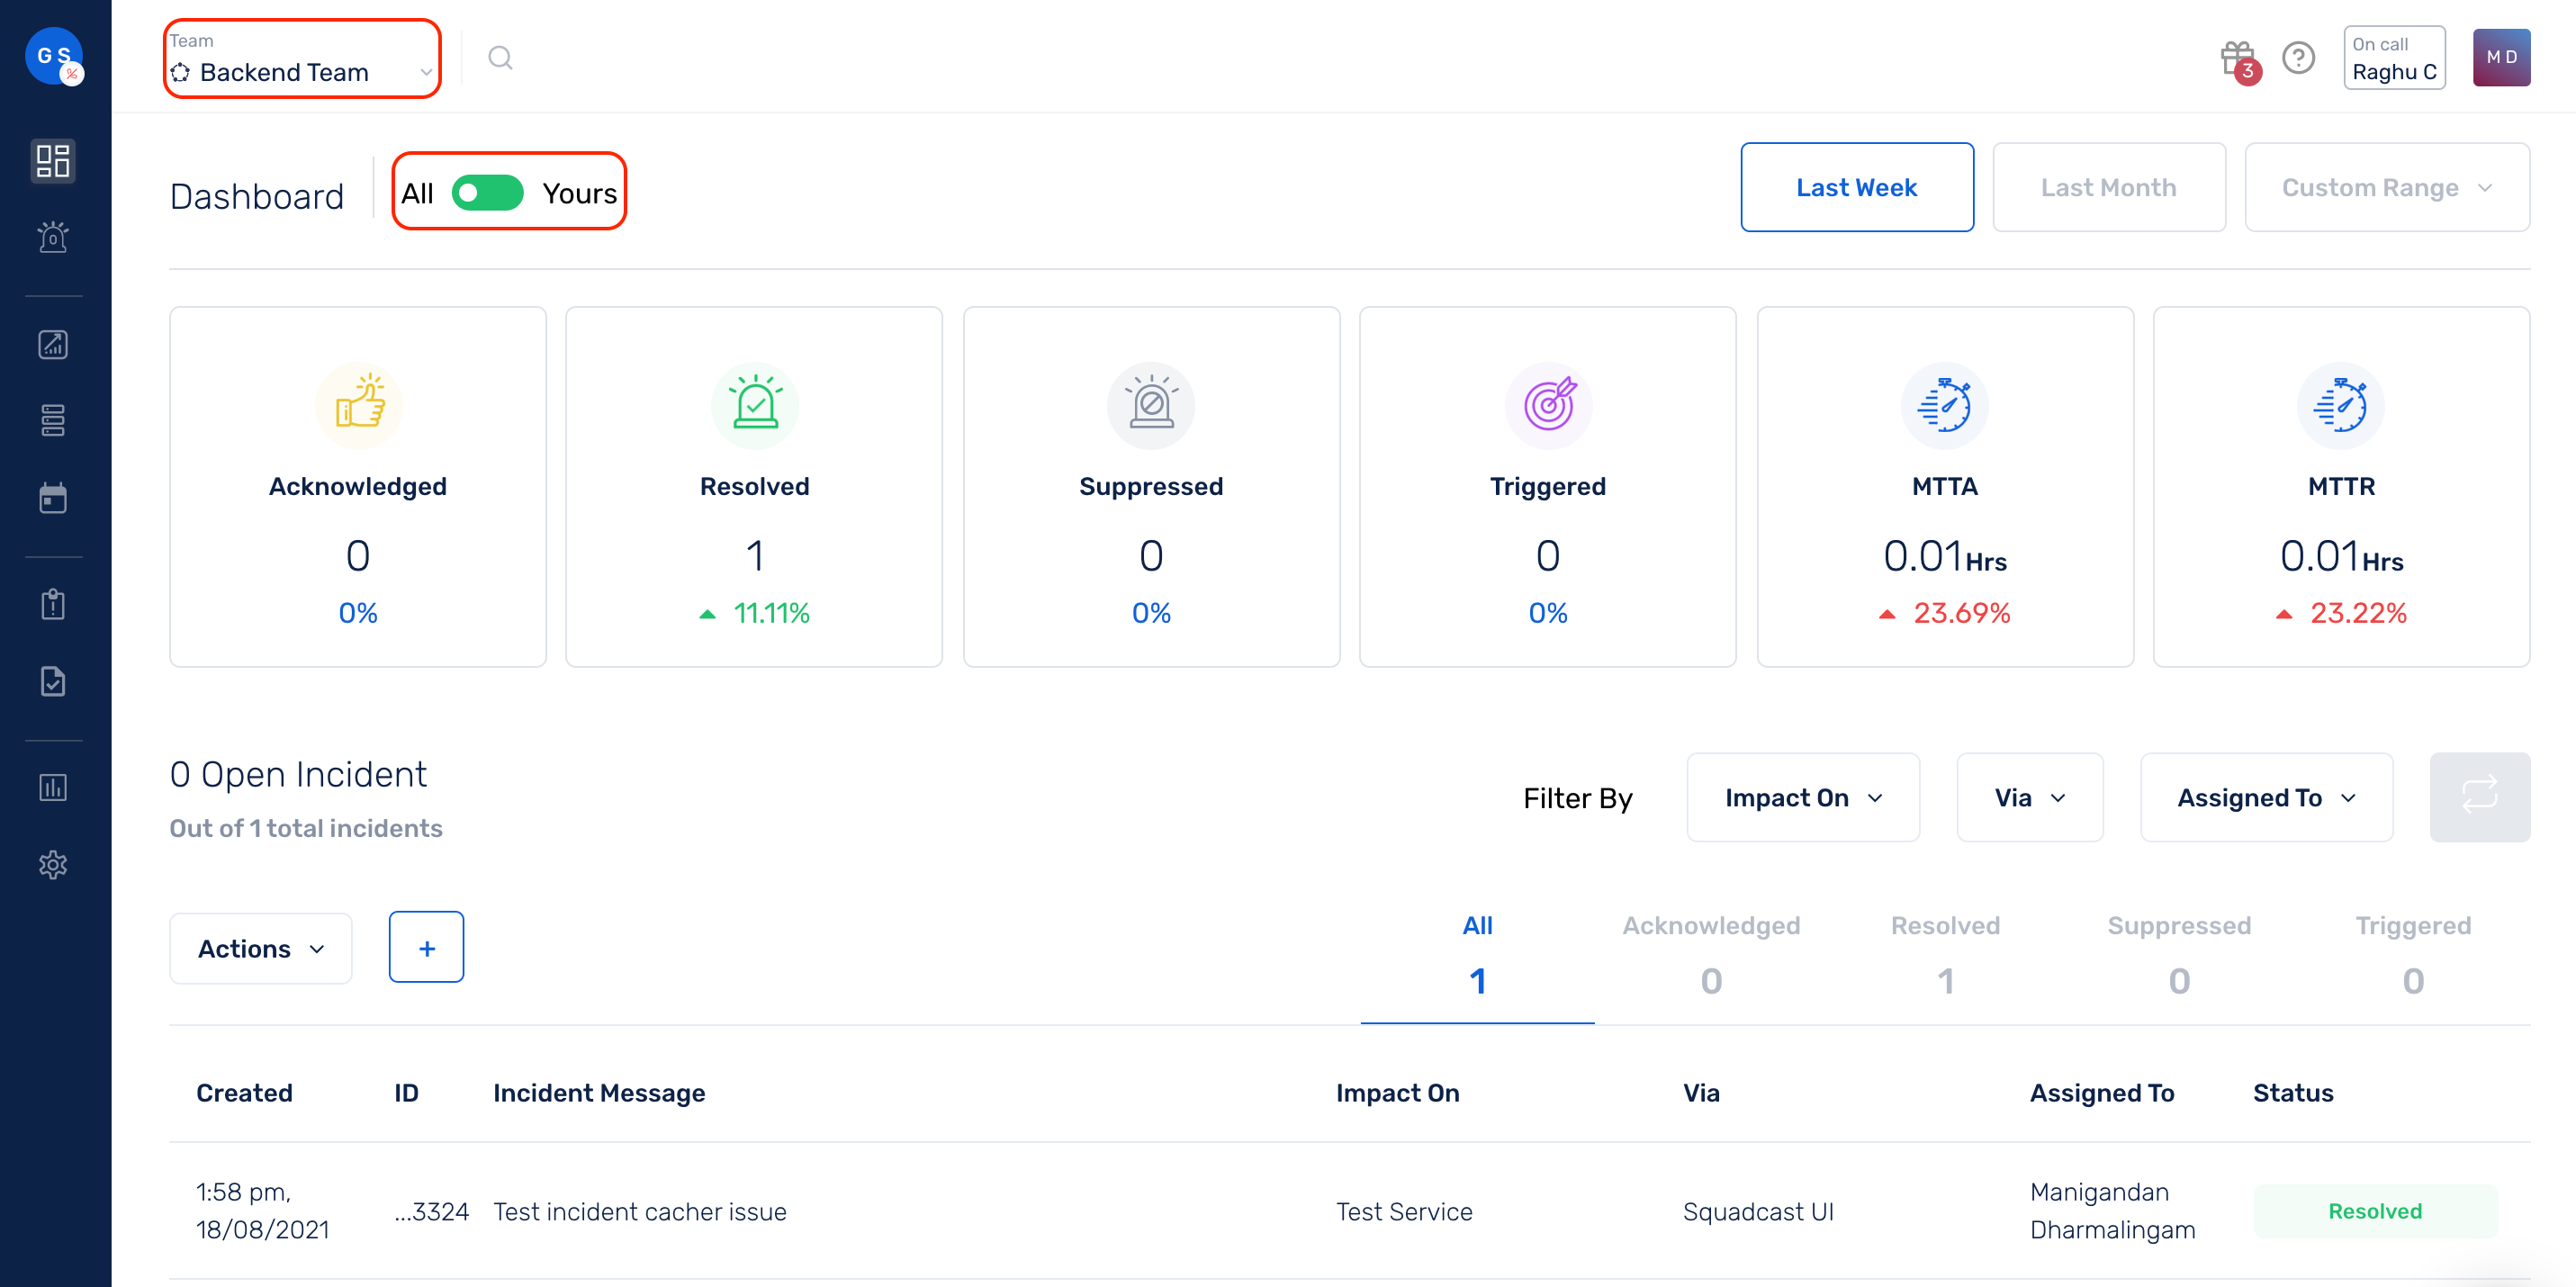
First, select a Team using the team picker on the top.
Incident State Metrics
Incident states metrics gives you a single view calculation of the number or volume of incidents in each of the respective states on Squadcast.
Triggered
An incident is considered to be in the triggered state before any user responds to the incident notification. Once an incident is triggered it will notify the on-call user(s) based on their notification rules. This also means that the incident is in the open state.
Acknowledged
An incident is considered to be in the acknowledged state when a user has acknowledged an incident and is working on resolving it.
Resolved
An incident considered resolved when the user has fixed the issue and they want the incident to be closed. Once an incident is resolved, no additional notifications will be sent and the incident cannot be opened again. This is one of the two final incident states in Squadcast.
Suppressed
All incidents that evaluate to be true for any of the Supression Rules configured for a Service (or incidents that come in for the Service when it is under maintenance) will automatically go into the suppressed state. This, and resolved are the two final states in Squadcast.
Response Metrics
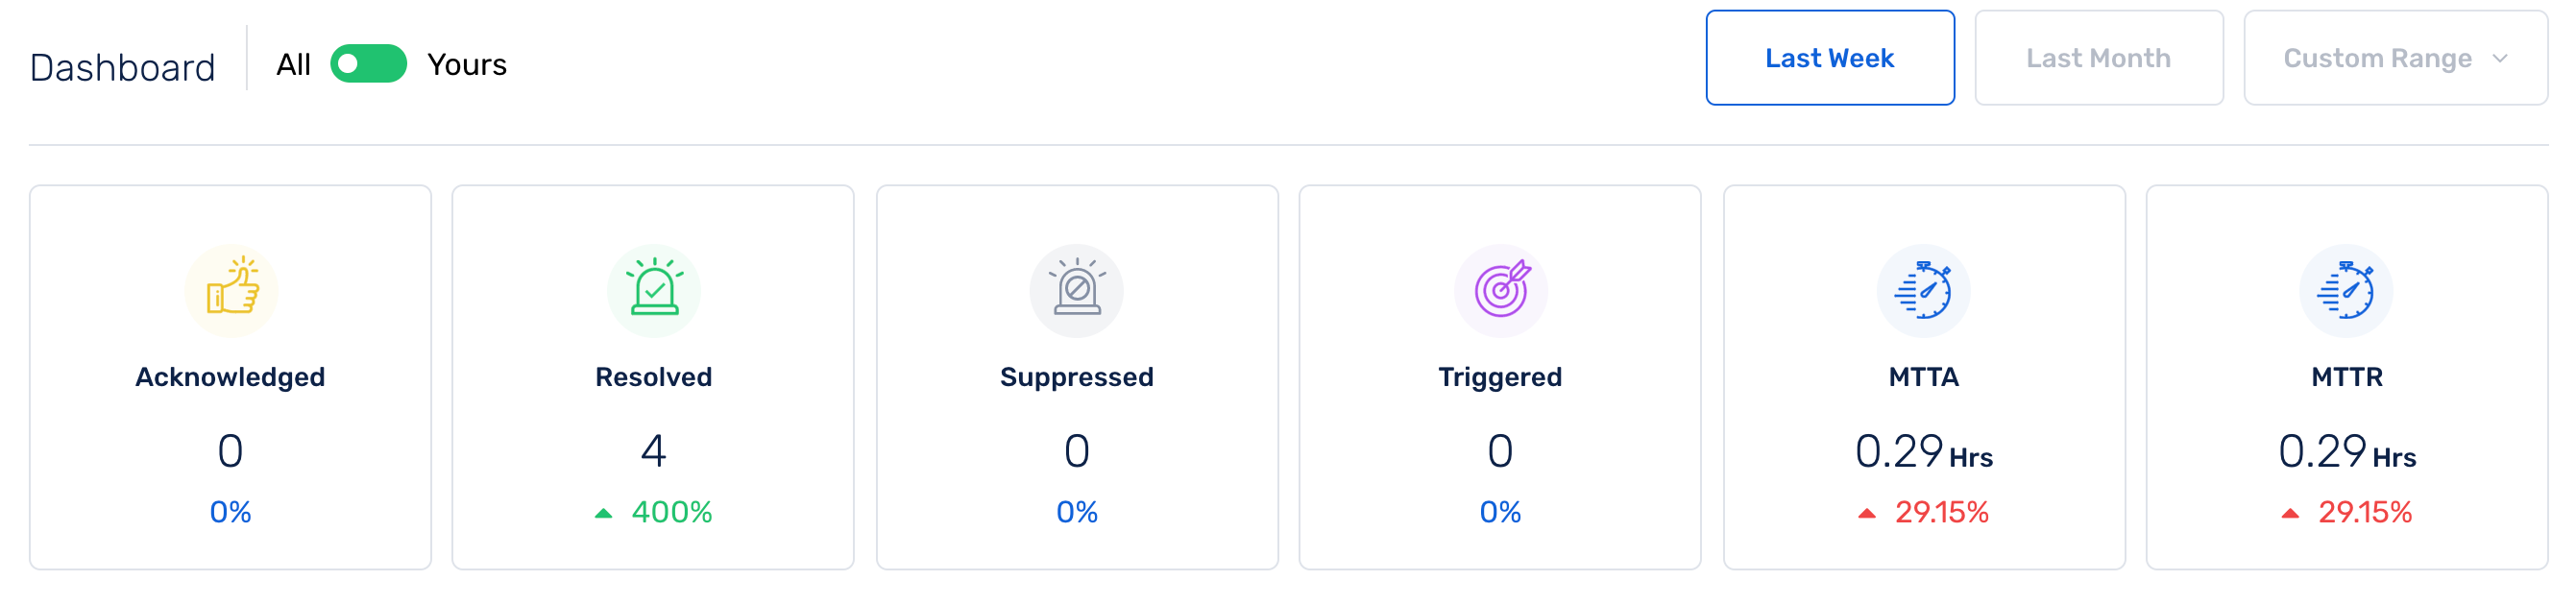
Response metrics indicate the time taken to acknowledge and resolve a triggered incident. Typically, response metrics are used as a baseline to improve your incident response processes.
MTTA
Mean Time To Acknowledge is the average time taken to acknowledge incidents. When the dashboard is toggled to Yours, the incident metrics summary shows your MTTA and when it is toggled to All, the MTTA for the whole Team is shown.
Note: The MTTA is calculated as a separate metric for every Team that you are a part of in Squadcast.
MTTR
Mean Time To Resolve is the average time taken to resolve incidents. When the dashboard is toggled to Yours, the incident metrics summary shows your MTTR and when it is toggled to All, the MTTR for the whole Team is shown.
Note: The MTTR is calculated as a separate metric for every Team that you are a part of in Squadcast.
Percentage calculation for each metric
You will notice a percentage calculation under each of these metrics with an arrow that denotes if there is an increase or decrease in volume/performance.
This percentage indicates a comparative calculation of the performance/volume of the metric in the selected time period versus the performance/volume of the metric for the same time duration in the past.
That is, if you have chosen the Last Week dashboard view, the percentages shown will be calculated this way:
- Incident States Percentages = (Total number of incidents in each state this week / Total number of incidents from last week that are still in the respective states) * 100
If you have 6 incidents in the Triggered state this week and you still have 2 incidents from last week which are still in the Triggered state when you are viewing the dashboard, then the percentage under Triggered should be:
Triggered% = 6 (This week) / 2 (Last Week) * 100 = 300%
- Response Metrics Percentages = (MTTR/MTTA recorded for this week / MTTR/MTTA recorded for last week) * 100
Based on the dashboard view that you have chosen, that is, Last week, Last Month, or a Custom Date Range, the metrics change as per the calculation stated above.
If a custom range view is chosen, the percentages are calculated the same way keeping in mind the window of time period selected by the user (in days) and is considered as the window of past metric comparison.
That is, if custom date range chosen is between 14th Feb - 17th Feb, then the time period selected here would be 4 days. So, this will be compared against the volume of incidents that have come in, in the past 4 days, that is, 10th Feb - 13th Feb.
The calculations would be as follows:
- Incident States Percentages = (Total number of incidents from 14th Feb - 17th Feb / Total number of incidents from 10th - 13th) * 100
- Response Metrics Percentages = (MTTR/ MTTA recorded for 14th Feb - 17th Feb / MTTR/ MTTA recorded for 10th - 13th) * 100
Typically, the aim of an incident response system is to ensure that your MTTA and MTTR reduce. When the MTTA or MTTR percentage is in red, it means that there is an increase in the time taken to Acknowledge or Resolve incidents in comparison to the MTTA and MTTR performances in the past (same time duration considered as chosen in the dashboard view).
This is shown in order to improve the response times and is not meant to alarm the Teams or Users.