Sumo Logic
Follow the steps below to configure a service so as to extract its related alert data from Sumo Logic.
Squadcast will then process this information to create incidents for this service as per your preferences.
Using Sumo Logic as an Alert Source
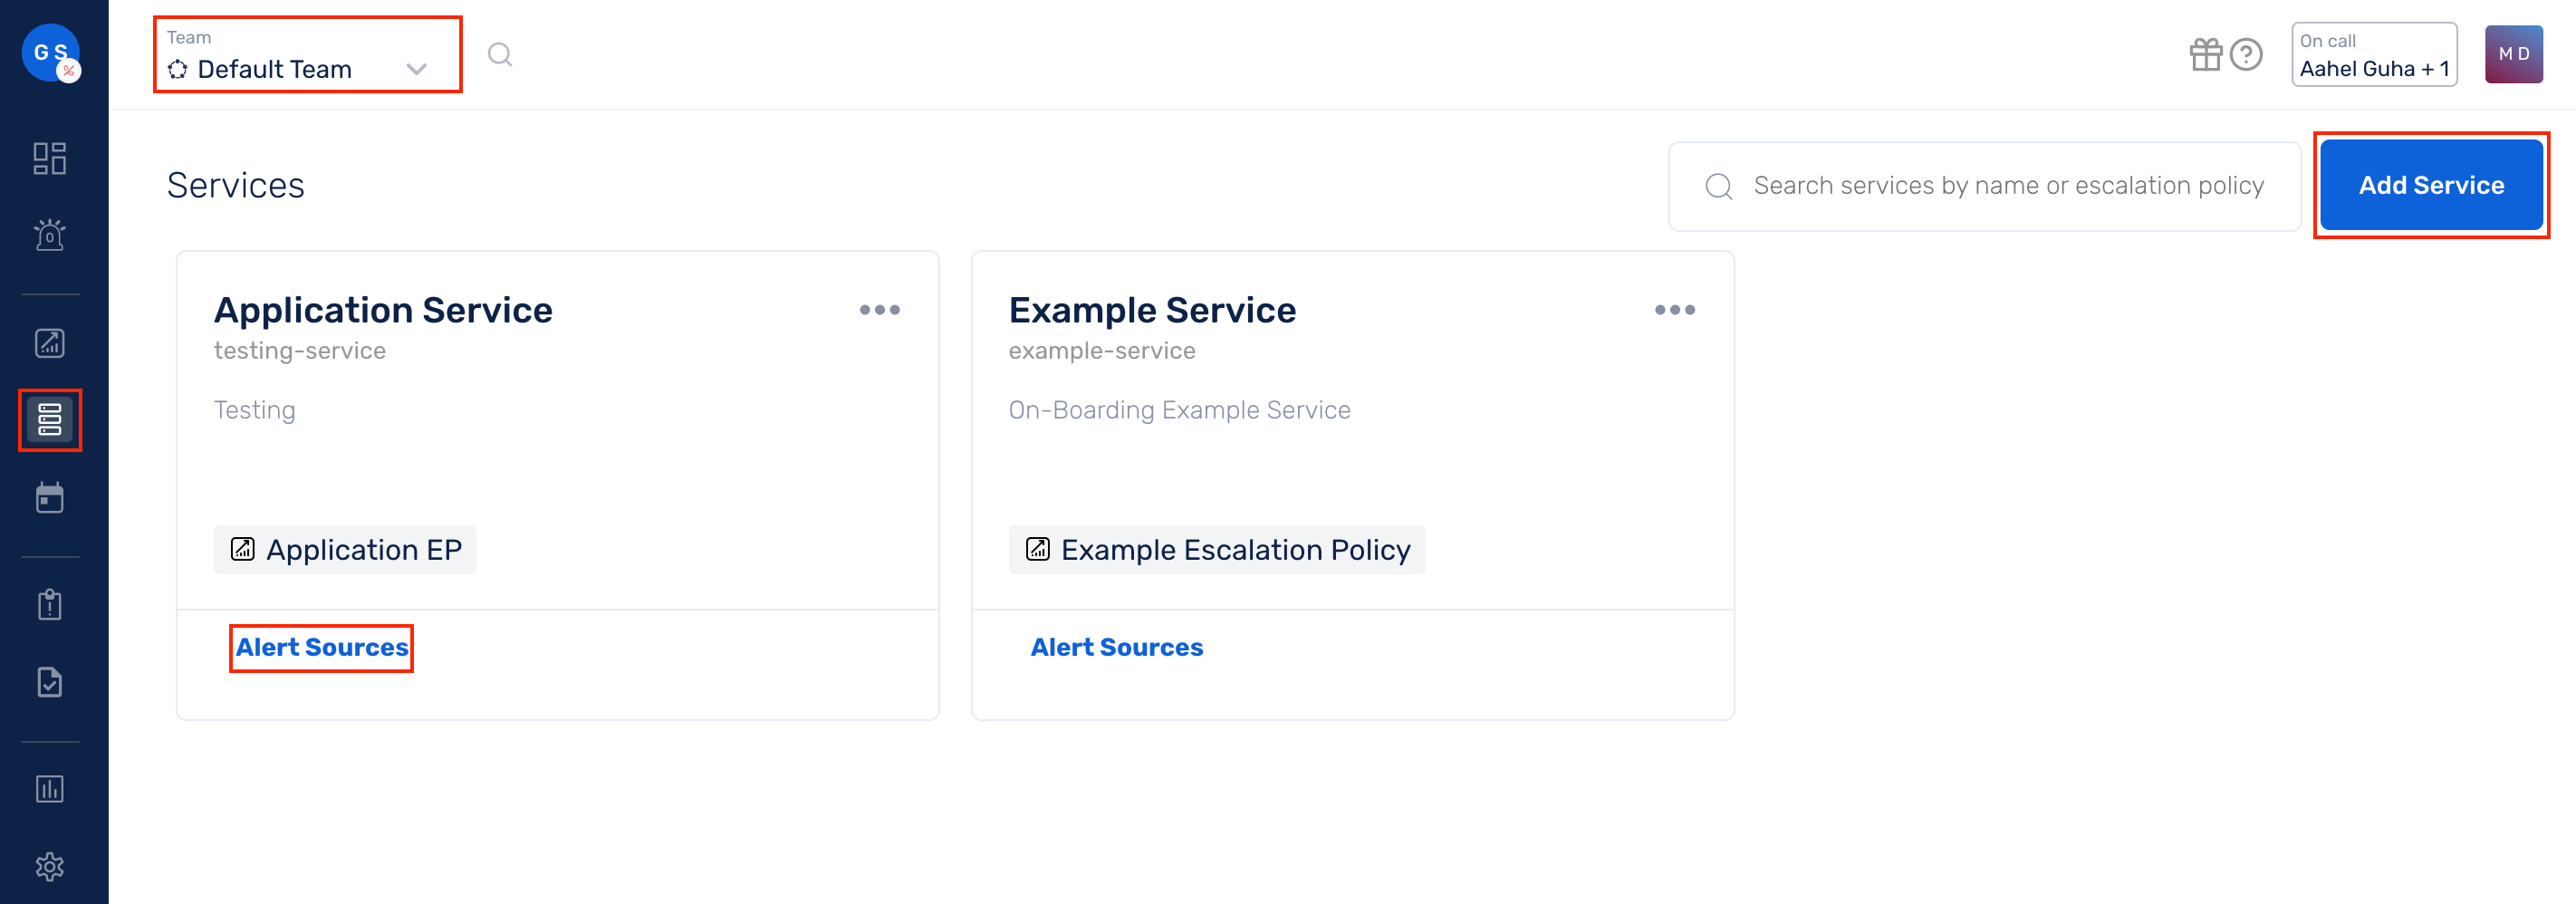
(1) From the navigation bar on the left, select Services. Pick the applicable Team from the Team-picker on the top. Next, click on Alert Sources for the applicable Service
(2) Search for Sumo Logic from the Alert Source drop-down and copy the Webhook URL
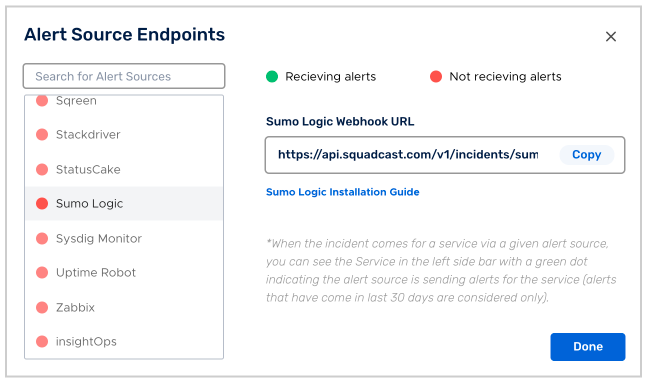
For an Alert Source to turn active (indicated by a green dot - Receiving alerts against the name of the Alert Source in the drop-down), you can either generate a test alert or wait for a real-time alert to be generated by the Alert Source.
An Alert Source is active if there is a recorded incident via that Alert Source for the Service in the last 30 days.
Creating Squadcast Webhook in Sumo Logic
With Sumo Logic, the user will have to configure what the payload JSON will be.
So, for integrating with Squadcast, we have defined 2 different payload formats.
- Log Alerts
- Metric Alerts
So, we’ll create 2 Webhook connections with different payload formats.
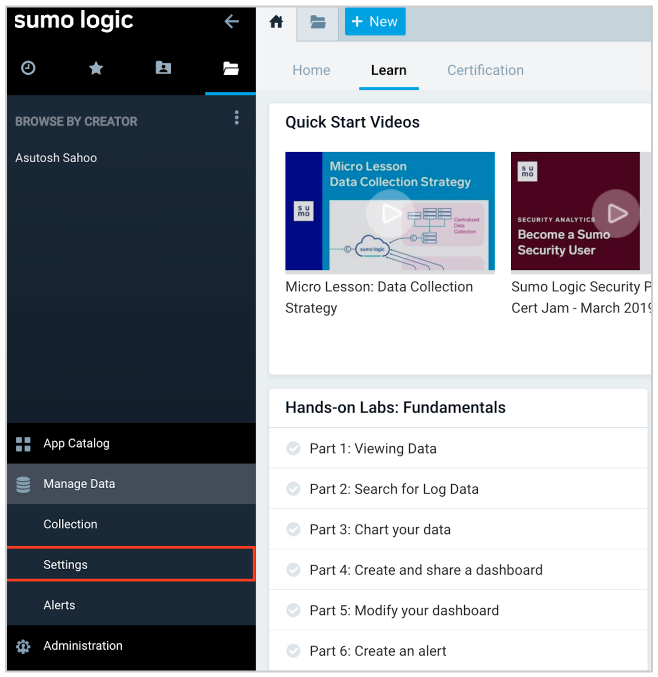
1.Login to your sumo logic dashboard and go to the Settings tab in the Manage Data section.
2.Select the Connections tab from the topbar.

3.Click on + button.

4.Select Webhook option.
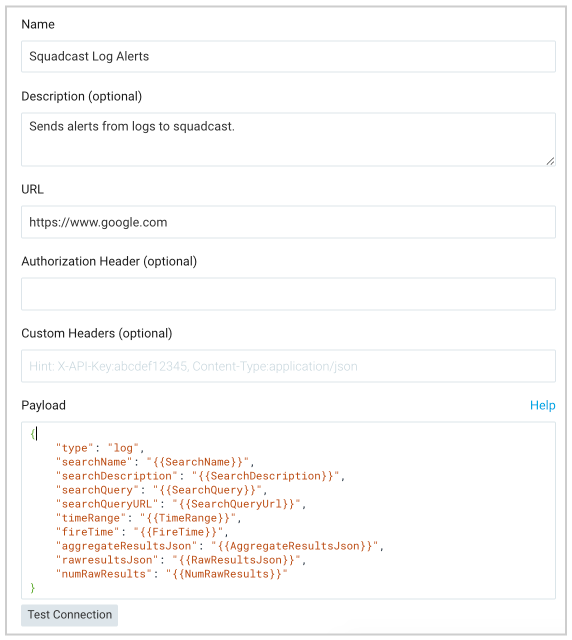
5.Add the Log Alerts webhook connection.
-
Paste the webhook URL copied from the Squadcast dashboard in the URL field.
-
In the payload field, past the following
{
    "type": "log",
    "searchName": "",
    "searchDescription": "",
    "searchQuery": "",
    "searchQueryURL": "",
    "timeRange": "",
    "fireTime": "",
    "aggregateResultsJson": "",
    "rawresultsJson": "",
    "numRawResults": ""
}
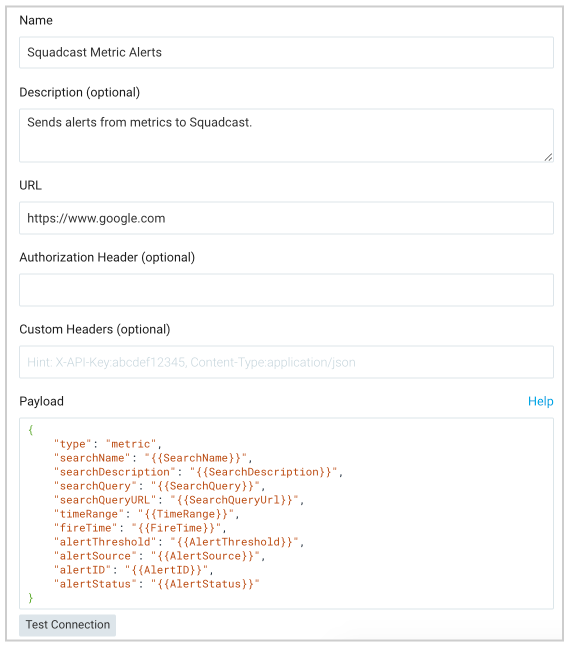
6.Similarly, add Metric Alerts webhook connection.
-
Paste the same webhook URL copied from the Squadcast dashboard in the URL field.
-
In the payload field, past the following
{
    "type": "metric",
    "searchName": "",
    "searchDescription": "",
    "searchQuery": "",
    "searchQueryURL": "",
    "timeRange": "",
    "fireTime": "",
    "alertThreshold": "",
    "alertSource": "",
    "alertID": "",
    "alertStatus": ""
}
Setting up Alerting for Logs
- Follow the article: Schedule Searches for Webhook Connections for configuring alerts for logs.
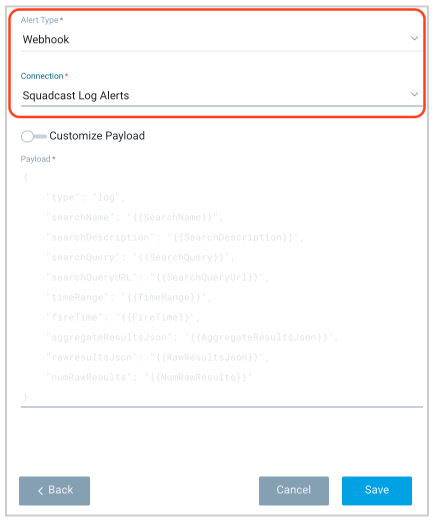
-
In the Alert Type drop-down, select Webhook.
-
In the Connection drop-down, select Squadcast Log Alerts.
Setting up Alerting for Metrics
- Refer the video: Monitor your Metrics in Real-Time with Sumo Logic Alerts for configuring alerts for Metrics.

- In the Send Notification Via dropdown, select Squadcast Metric Alerts.
Now, whenever the webhook is triggered for either Log/Metric, an incident is autmatically created in Squadcast. But, the resolving of incident needs to be done manually by going to Squadcast dashboard.