Elastic
We'll be using Watcher (formerly known as X-Pack Alerting) for getting alerts from Elastic. You need to setup watcher for your elastic cluster. For more information on that, visit Getting Started with Watcher
We’ll be using Watcher (formerly known as X-Pack Alerting) for getting alerts from Elastic.
Follow the steps below to configure a service so as to extract its related alert data from Elastic.
Squadcast will then process this information to create incidents for this service as per your preferences.
Using Elastic as an Alert Source
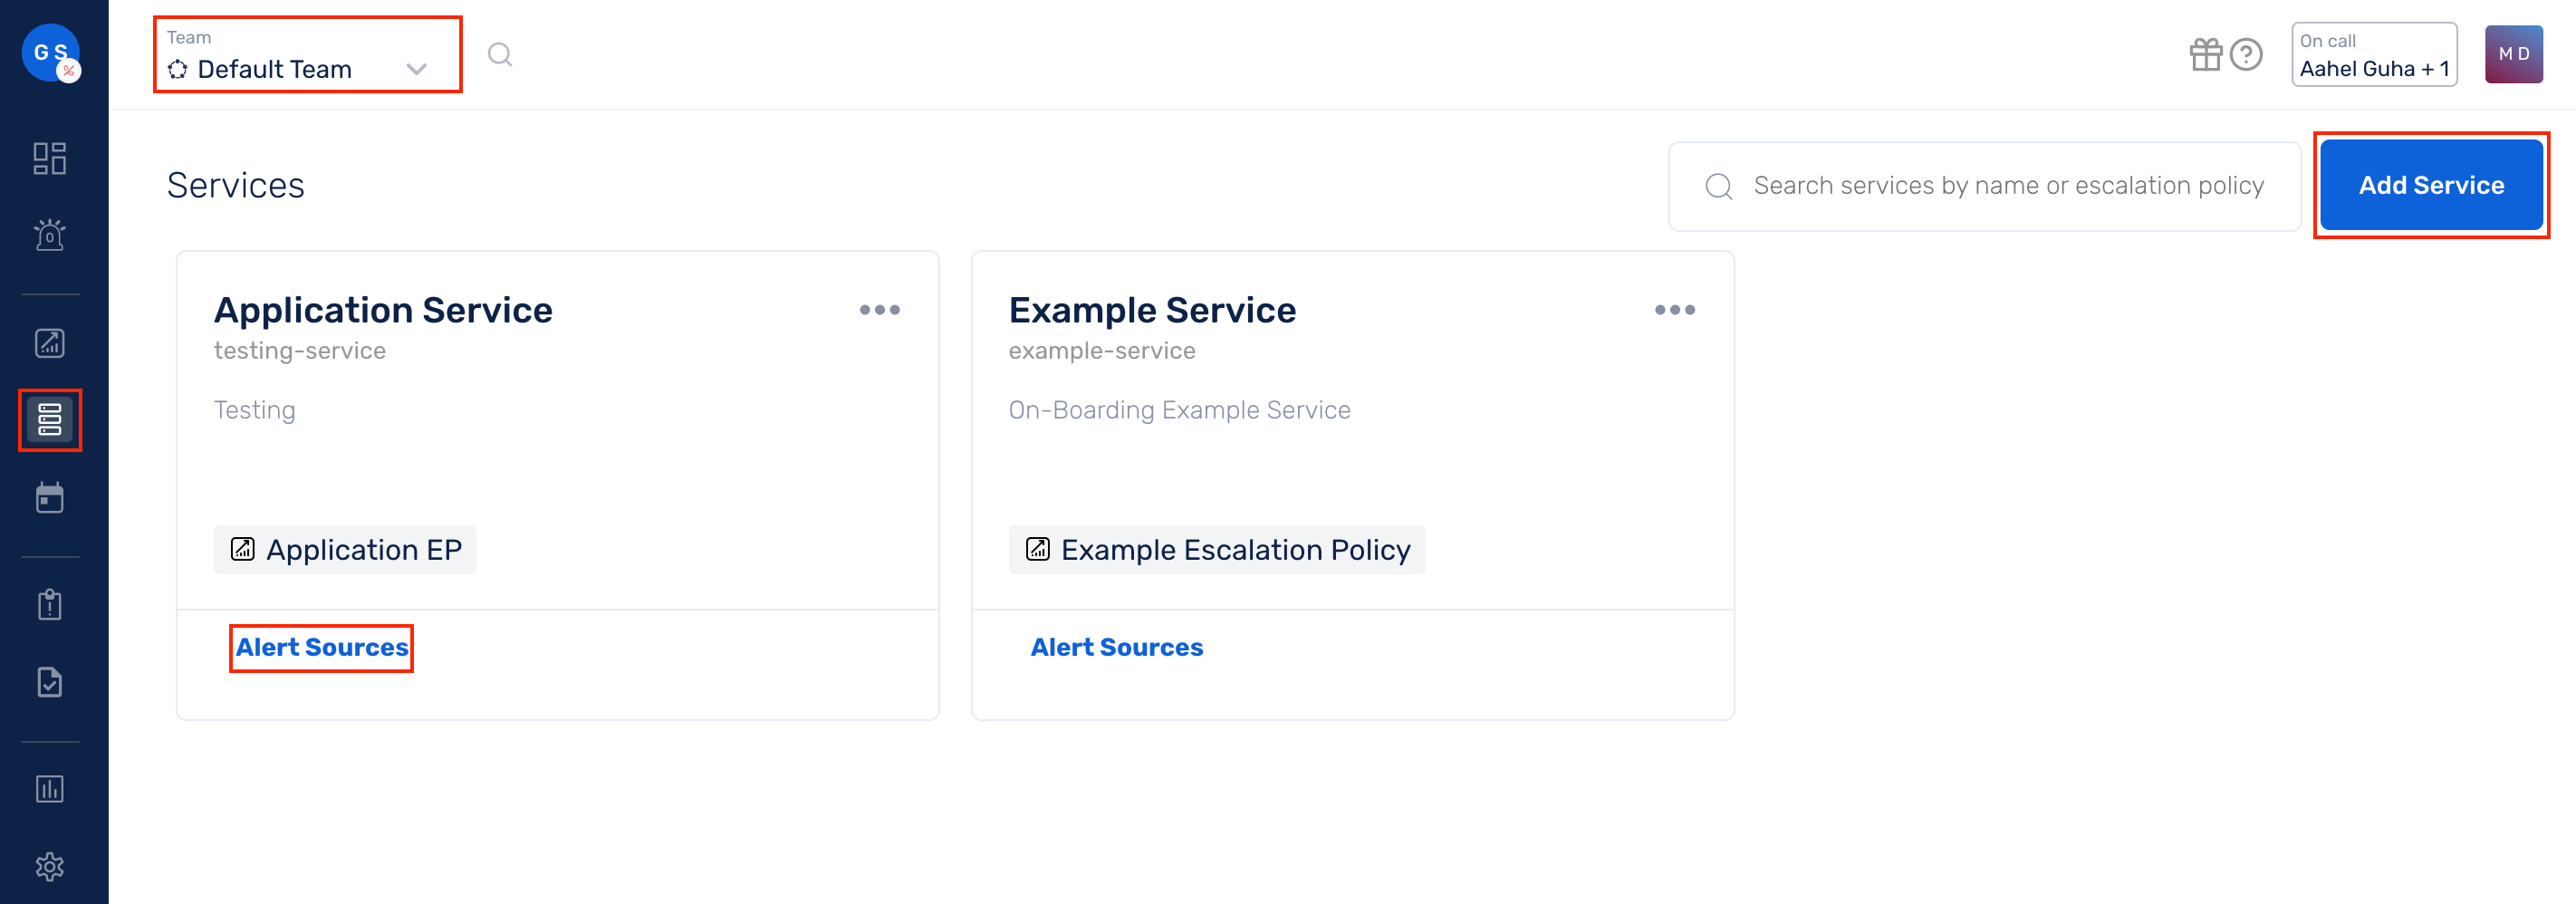
(1) From the navigation bar on the left, select Services. Pick the applicable Team from the Team-picker on the top. Next, click on Alert Sources for the applicable Service

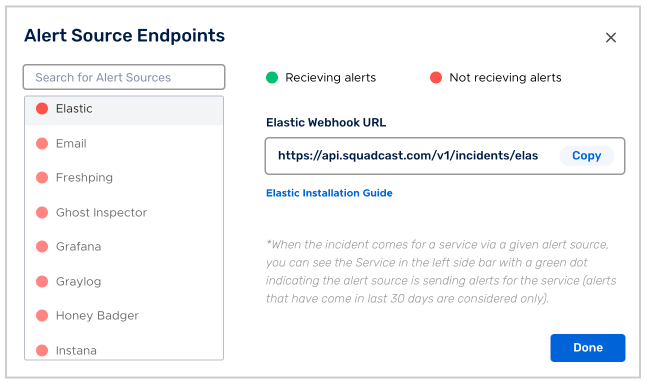
(2) Search for Elastic from the Alert Source drop-down and copy the Webhook URL

For an Alert Source to turn active (indicated by a green dot - Receiving alerts against the name of the Alert Source in the drop-down), you can either generate a test alert or wait for a real-time alert to be generated by the Alert Source.
An Alert Source is active if there is a recorded incident via that Alert Source for the Service in the last 30 days.
Create a squadcast webhook in Elastic
Now given the configurable nature of how Watcher alerting works in Elastic, we can generate our own custom alerts for almost anything we are monitoring in Elastic. Also, the payload JSON to be sent is defined by the user himself.
- In this document, we'll go through setting up a watcher for monitoring the **Heath of the Elastic Cluster** as a sample criteria for triggering alerts.
- We have assumed that the elasticsearch server is running at http://localhost:9200
1.Verify that Watcher is set up and running on your server.
Execute the following in your terminal.
curl -X GET 'http://localhost:9200/_watcher/stats?pretty'
You should get a response something like the following
{
  "_nodes" : {
    "total" : 1,
    "successful" : 1,
    "failed" : 0
  },
  "cluster_name" : "elasticsearch_asutoshsahoo",
  "manually_stopped" : false,
  "stats" : [
    {
      "node_id" : "gUpDTNkrQoqQ_ebNakBYEQ",
      "watcher_state" : "started",
      "watch_count" : 6,
      "execution_thread_pool" : {
        "queue_size" : 0,
        "max_size" : 0
      }
    }
  ]
}
2.Verify that the cluster health endpoint is functioning.
Execute the following in your terminal.
curl -X GET 'http://localhost:9200/_cluster/health?pretty'
You should get a response something like the following
{
  "cluster_name" : "elasticsearch_asutoshsahoo",
  "status" : "yellow",
  "timed_out" : false,
  "number_of_nodes" : 1,
  "number_of_data_nodes" : 1,
  "active_primary_shards" : 20,
  "active_shards" : 20,
  "relocating_shards" : 0,
  "initializing_shards" : 0,
  "unassigned_shards" : 1,
  "delayed_unassigned_shards" : 0,
  "number_of_pending_tasks" : 0,
  "number_of_in_flight_fetch" : 0,
  "task_max_waiting_in_queue_millis" : 0,
  "active_shards_percent_as_number" : 95.23809523809523
}
We’ll be using the status field in this response to decide whether to send alerts.
if status == 'green':
    send 'RESOLVE'
elif status == 'red':
    send 'TRIGGER'
3.Configure a watch with a Webhook action for Squadcast and use a PUT request to add it to your watcher. NOTE :- Note: The watch below is set to always execute every 10 seconds for testing purposes. In most production environments you will want to update the trigger and condition to only execute the action when there is an issue to reduce noise. You may also want to add a throttle period to your Squadcast action. You can find detailed instructions on configuring each aspect of your watches in the Elastic Watcher Documentation. .
Execute the following in your terminal
curl -X PUT "http://localhost:9200/_watcher/watch/cluster_health_watch" -H 'Content-Type: application/json' -d '{
  "trigger" : {
    "schedule" : { "interval" : "10s" }
  },
  "input" : {
    "http" : {
      "request" : {
       "url": "http://localhost:9200/_cluster/health"
      }
    }
  },
  "condition" : {
    "always" : {}
  },
  "actions" : {
    "squadcast_trigger": {
        "condition": {
            "compare": { "ctx.payload.status": { "eq": "red"} }
        },
        "webhook": {
            "url": "https://api.squadcast.com/v1/incidents/elastic/79fb2290d1fbebb94232290f793ffb7d442611d4",
            "body": "{ \"event\": \"TRIGGER\", \"id\": \"{ {ctx.watch_id} }\", \"message\": \"Watcher [{ {ctx.watch_id} }] triggered\", \"description\": \"Watch ID : { {ctx.watch_id} } \n Cluster Name : { {ctx.payload.cluster_name} } \n Cluster Status : { {ctx.payload.status} }, \"payload\": { {#toJson} }ctx{ {/toJson} } }",
            "headers": {"Content-type": "application/json"}
        }
    },
    "squadcast_resolve": {
        "condition": {
            "compare": { "ctx.payload.status": { "eq": "green"} }
        },
        "webhook": {
            "url": "https://api.squadcast.com/v1/incidents/elastic/79fb2290d1fbebb94232290f793ffb7d442611d4",
            "body": "{ \"event\": \"RESOLVE\", \"id\": \"{ {ctx.watch_id} }\", \"message\": \"Watcher [{ {ctx.watch_id} }] triggered\", \"description\": \"Watch ID : { {ctx.watch_id} } \n Cluster Name : { {ctx.payload.cluster_name} } \n Cluster Status : { {ctx.payload.status} }, \"payload\": { {#toJson} }ctx{ {/toJson} } }",
            "headers": {"Content-type": "application/json"}
        }
      }
  }
}'
Use the Elastic Webhook URL copied from the Squadcast dashboard in the url field inside webhook.
IMPORTANT : Like we had mentioned earlier, the payload JSON to the webhook it defined by the user himself. So, we have defined a format for the payload so as to make it most flexible for the end-user.
The payload JSON must have the following keys :-
-
event : This field can hold either “TRIGGER” or “RESOLVE”
-
id : This must have the same value for the “TRIGGER” and “RESOLVE” payloads and must be different from
idof other watches. So, it makes sense to usewatch_idfor this field. -
message : This would be the heading of the incident in the squadcast dashboard.
-
description : This would be the detailed description of the incident in the squadcast dashboard.
-
payload : This would be the whole ctx object. This is taken so as just to get some more metadata on the event which maybe useful in deduplicating.
So, a sample payload JSON would look like
{
  "event": "TRIGGER",
  "id": "cluster_health_watch",
  "message": "Watcher [cluster_health_watch] triggered",
  "description": "Watch ID :- cluster_health_watch \n Cluster Name :- elasticsearch_asutoshsahoo \n Cluster Status :- yellow",
  "payload": {
    "metadata": {
      "xpack": {
        "type": "json"
      }
    },
    "watch_id": "cluster_health_watch",
    "payload": {
      "number_of_pending_tasks": 0,
      "cluster_name": "elasticsearch_asutoshsahoo",
      "active_shards": 32,
      "active_primary_shards": 32,
      "unassigned_shards": 1,
      "delayed_unassigned_shards": 0,
      "timed_out": false,
      "relocating_shards": 0,
      "_headers": {
        "content-type": [
          "application/json; charset=UTF-8"
        ]
      },
      "initializing_shards": 0,
      "task_max_waiting_in_queue_millis": 0,
      "number_of_data_nodes": 1,
      "number_of_in_flight_fetch": 0,
      "active_shards_percent_as_number": 96.96969696969697,
      "_status_code": 200,
      "status": "yellow",
      "number_of_nodes": 1
    },
    "id": "cluster_health_watch_4d02dd10-54ac-4efe-b0f2-e02bfc294f58-2019-09-16T06:59:15.829Z",
    "trigger": {
      "triggered_time": "2019-09-16T06:59:15.829Z",
      "scheduled_time": "2019-09-16T06:59:15.357Z"
    },
    "vars": {},
    "execution_time": "2019-09-16T06:59:15.829Z"
  }
}
Now, whenever the cluster status becomes red, an incident will be created automatically in squadcast. Once it becomes green, the incident will get automatically resolved.
NOTE
-
Just like watch for elastic cluster health, we can setup watch for other elastic metrics as well.
-
We have tried to do deduplication in Squadcast so that multiple triggers for the same incident would only create a single event in Squadcast dashboard. Still, try to configure watcher from your end to ensure minimal noise.