LogicMonitor
This document will help you integrate LogicMonitor with Squadcast.
LogicMonitor is a fully-automated, cloud-based infrastructure monitoring platform for Enterprise IT and Managed Service Providers giving full-stack visibility into networks, cloud, servers with one unified view. Route detailed monitoring alerts from LogicMonitor to the right users in Squadcast.
How to integrate LogicMonitor with Squadcast
In Squadcast: Using LogicMonitor as an Alert Source
(1) From the navigation bar on the left, select Services. Pick the applicable Team from the Team-picker on the top. Next, click on Alert Sources for the applicable Service
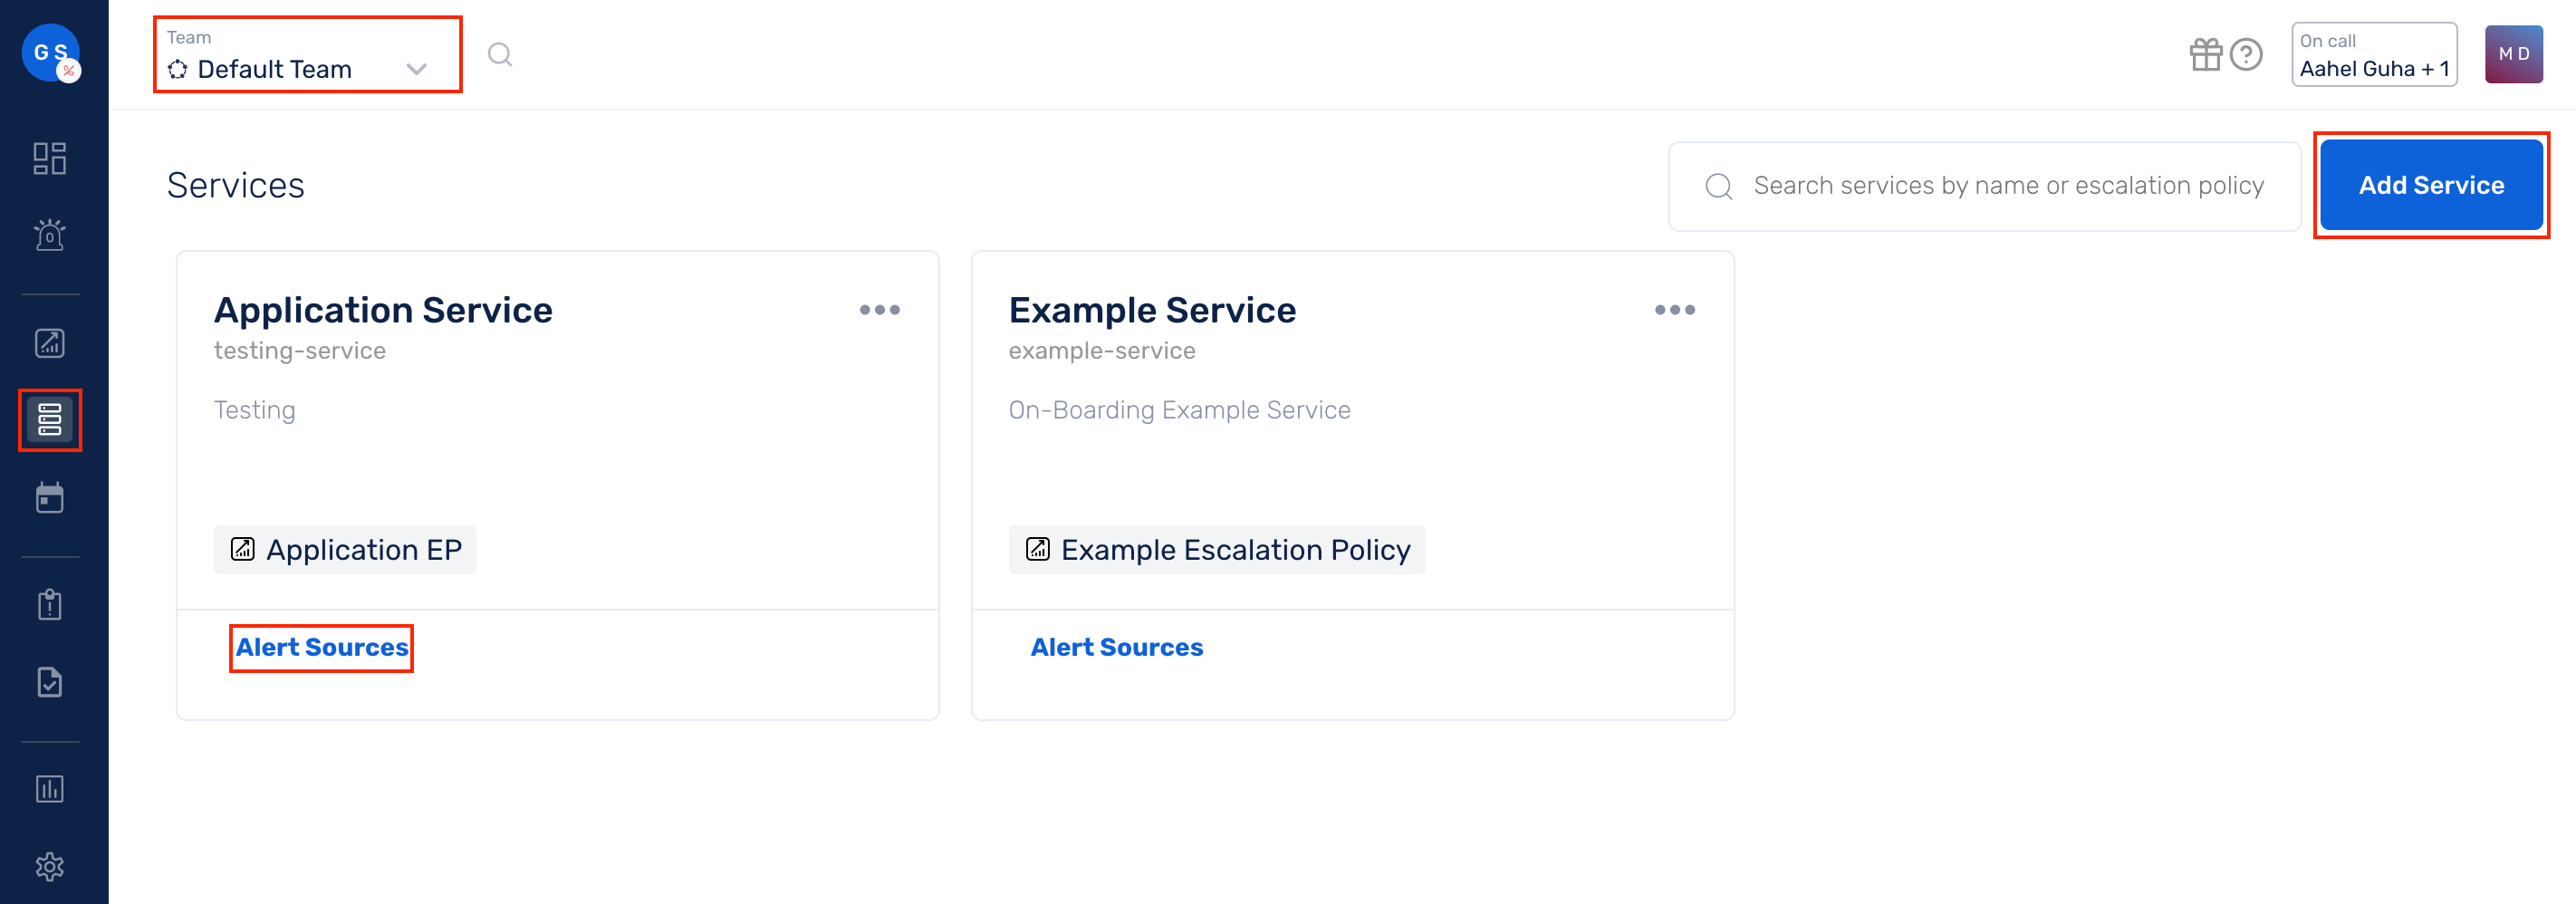
(2) Search for LogicMonitor from the Alert Source drop-down and copy the Webhook URL
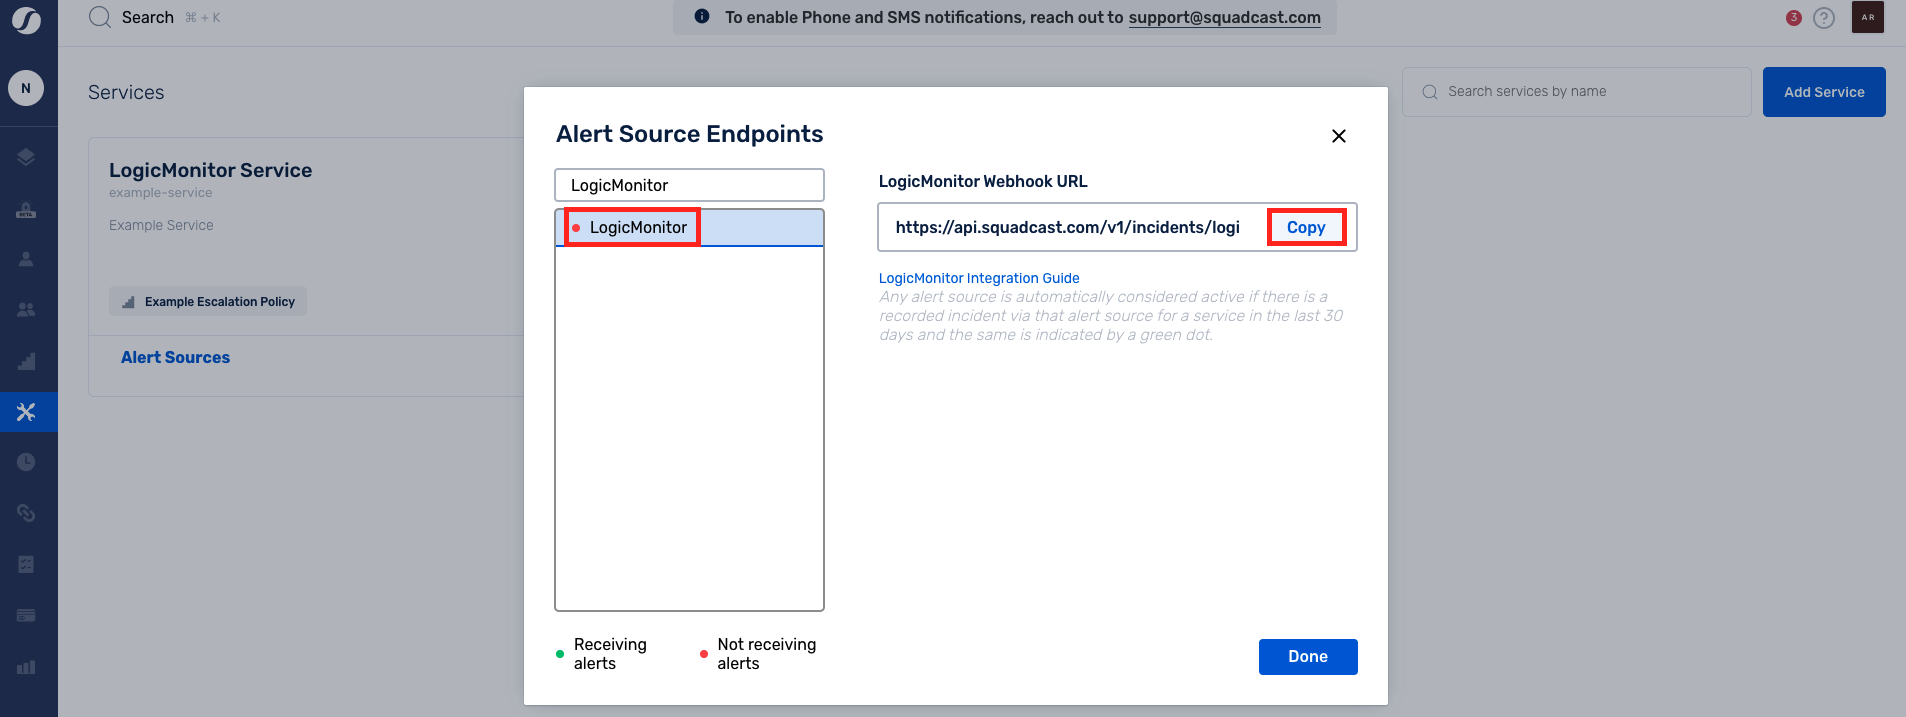
For an Alert Source to turn active (indicated by a green dot - Receiving alerts against the name of the Alert Source in the drop-down), you can either generate a test alert or wait for a real-time alert to be generated by the Alert Source.
An Alert Source is active if there is a recorded incident via that Alert Source for the Service in the last 30 days.
In LogicMonitor: Add a webhook for Squadcast
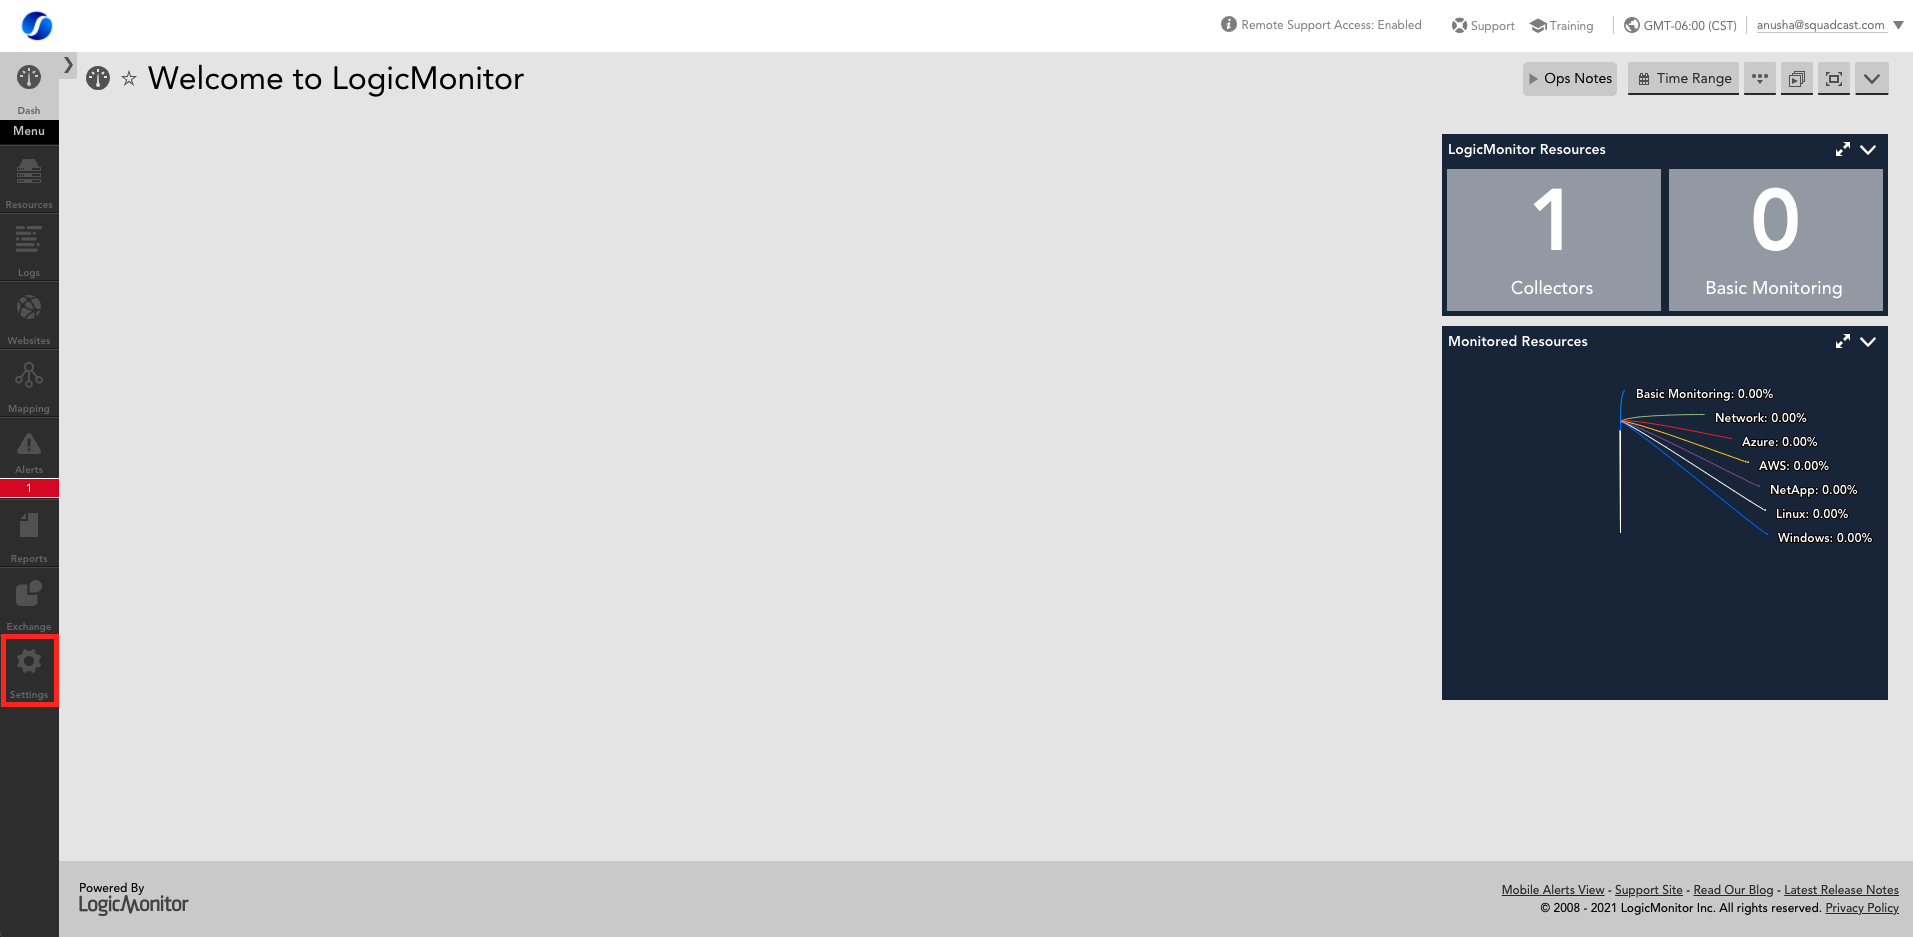
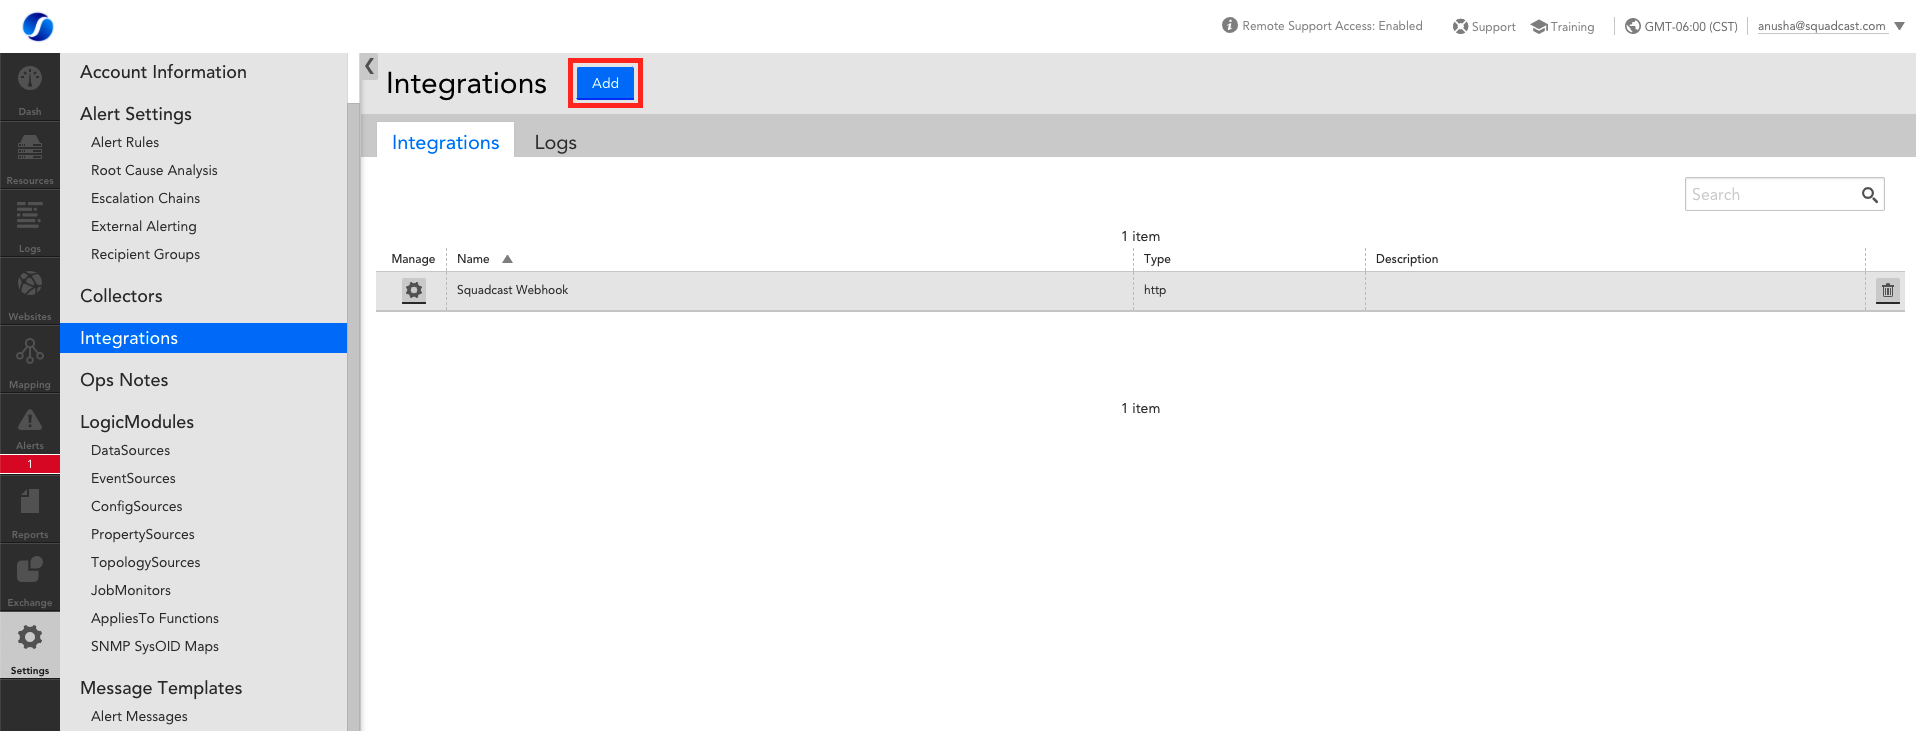
(1) From the dashboard, navigate to Settings
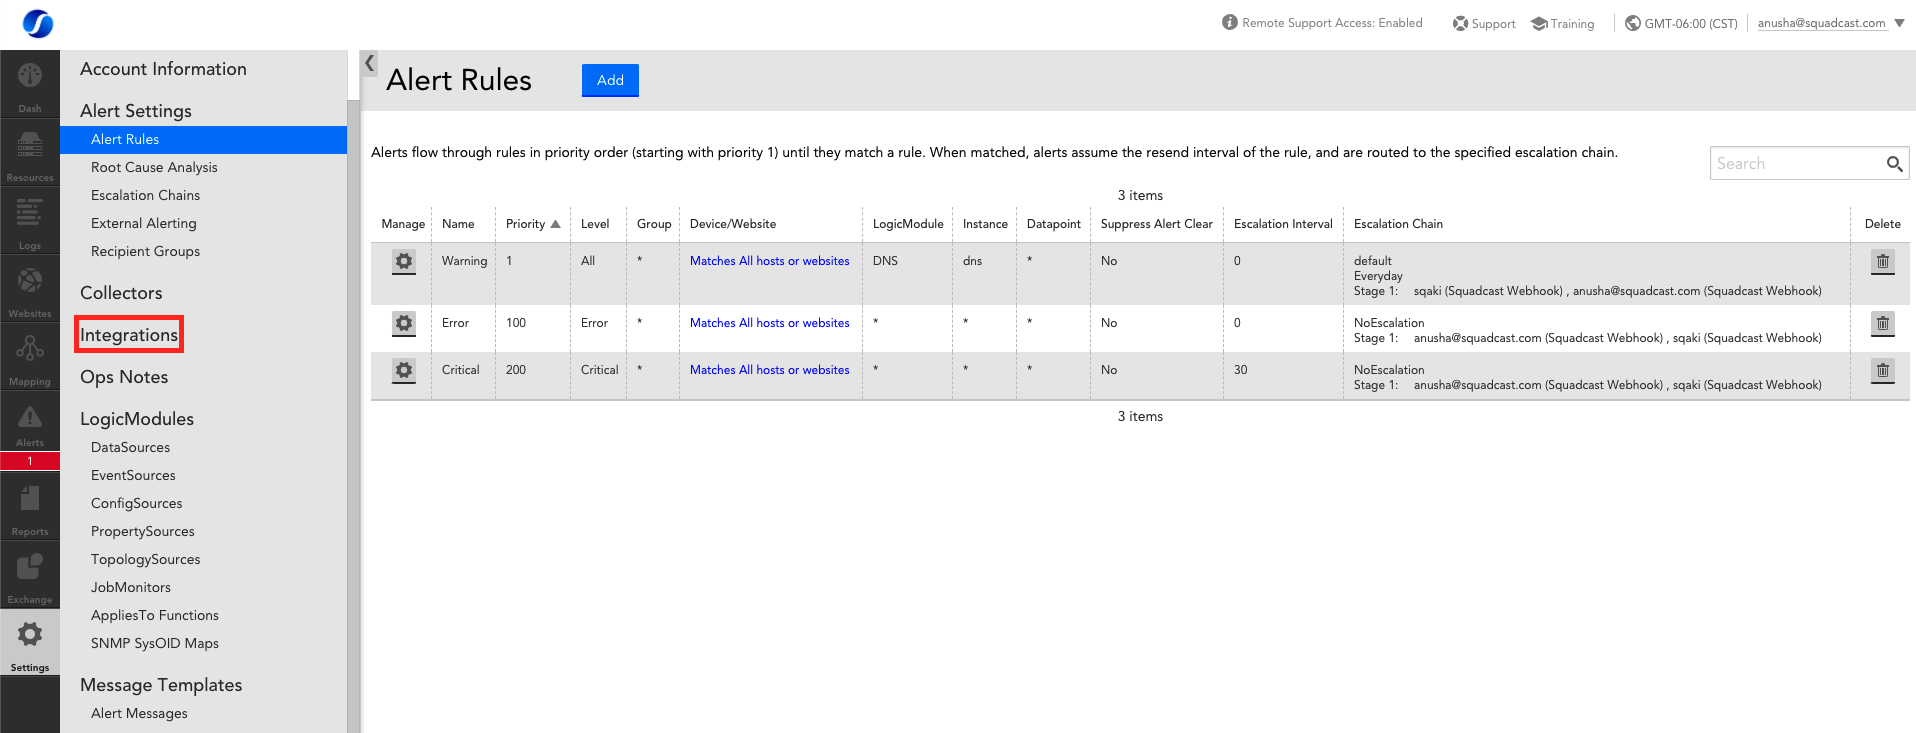
(2) Select Integrations from the sidebar
(3) Select Add to add the new endpoint
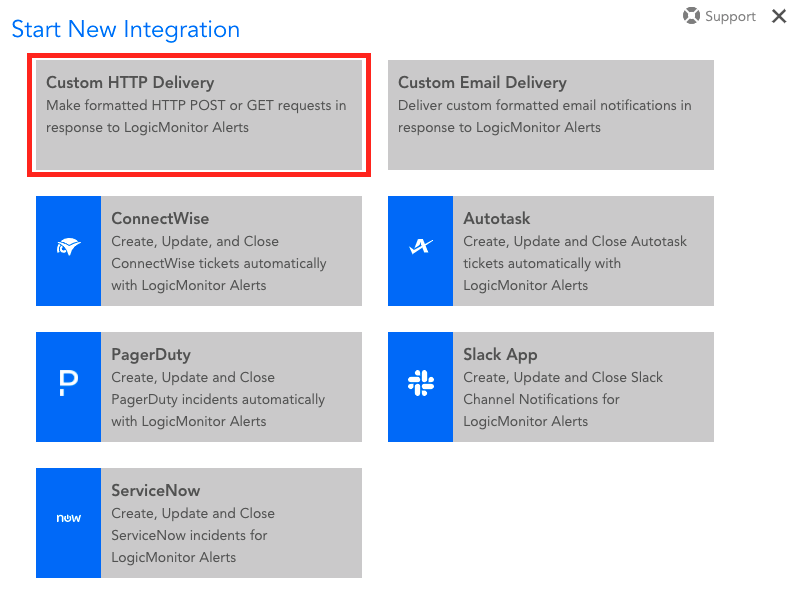
(4) Select Custom HTTP Delivery since we want to configure a custom webhook
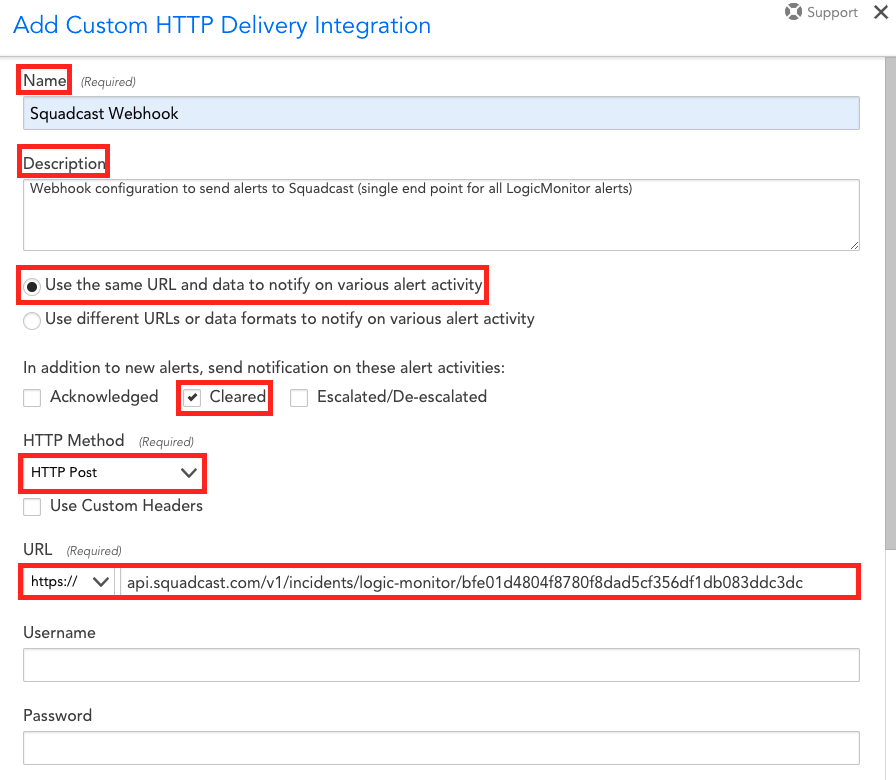
- Give the integration a meaningul Name, such as, Squadcast Webhook
- Provide an optional Description
- You can either choose to Use the same URL and data to notify on various alert activity (one single Squadcast Service webhook) or Use differents URLs or data formats to notify on various alert activity (multiple Squadcast Services webhooks). Either of the options you choose, you can follow the steps below, as many times as required (per each webhook)
- Choose Cleared checkbox since this will enable auto-resolution for incidents in Squadcast
- HTTP Method: From the drop-down, choose HTTP Post. Do not enable/use Custom Headers
- In the URL field, first select https:// from the drop-down on the left and paste the copied Squadcast webhook by removing the https:// prefix from the URL
- Provide Username and Password if applicable
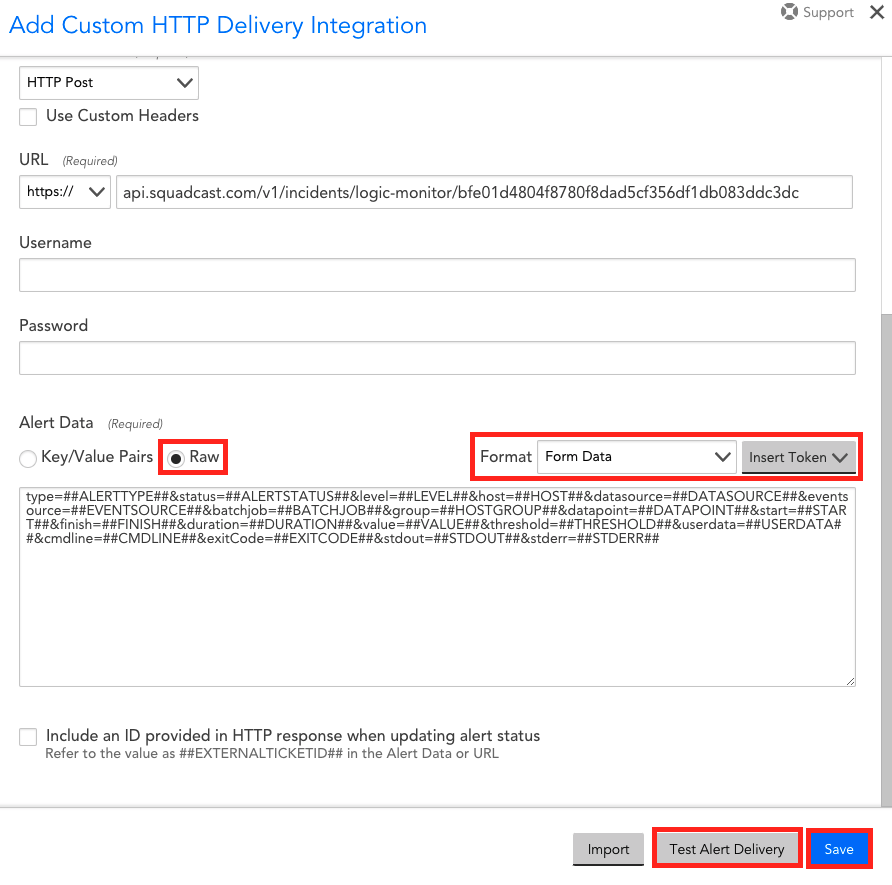
- Within Alert Data, paste the following template:
service=##SERVICE##&alertid=##ALERTID##&alerttype=##ALERTTYPE##&alertstatus=##ALERTSTATUS##&level=##LEVEL##&host=##HOST##&datasource=##DATASOURCE##&eventsource=##EVENTSOURCE##&batchjob=##BATCHJOB##&group=##GROUP##&datapoint=##DATAPOINT##&start=##START##&finish=##FINISH##&duration=##DURATION##&value=##VALUE##&threshold=##THRESHOLD##&userdata=##USERDATA##&cmdline=##CMDLINE##&exitCode=##EXITCODE##&stdout=##STDOUT##&stderr=##STDERR##&agent=##AGENT_DESCRIPTION##&checkpoint=##CHECKPOINT##&datapointdesc=##DPDESCRIPTION##&hostdesc=##HOSTDESCRIPTION##&hostinfo=##system.sysinfo##&hostips=##system.ips##&hosturl=##DEVICEURL##&instance=##INSTANCE##&dsidesc=##DSIDESCRIPTION##&batchdesc=##BJDESCRIPTION##&hostname=##system.hostname##&dsdesc=##DSDESCRIPTION##&eventmsg=##LIMITEDMESSAGE##&eventlogmsg=##MESSAGE##&eventcode=##EVENTCODE##&eventtype=##TYPE##&eventuser=##USER##&eventlogfile=##LOGFILE##&servicedetail=##DETAIL##&serviceurl=##URL##&servicegroup=##SERVICEGROUP##&date=##DATE##&clearvalue=##CLEARVALUE##&internalid=##INTERNALID##&alerturl=##ALERTDETAILURL##
Note: Custom User Defined Variables
Users can define two custom variables within Alert Data. The two variables can be added in the format mentioned below :
&CustomVariable1Name=##Name##&CustomVariable1Value=##Value## &CustomVariable2Name=##Name##&CustomVariable2Value=##Value##
Replace the ##Name## & ##Value## with proper values and add at the end of the variables mentioned in Step 4. This is how it would look like :
service=##SERVICE##&alertid=##ALERTID##&alerttype=##ALERTTYPE##&alertstatus=##ALERTSTATUS##&level=##LEVEL##&host=##HOST##&datasource=##DATASOURCE##&eventsource=##EVENTSOURCE##&batchjob=##BATCHJOB##&group=##GROUP##&datapoint=##DATAPOINT##&start=##START##&finish=##FINISH##&duration=##DURATION##&value=##VALUE##&threshold=##THRESHOLD##&userdata=##USERDATA##&cmdline=##CMDLINE##&exitCode=##EXITCODE##&stdout=##STDOUT##&stderr=##STDERR##&agent=##AGENT_DESCRIPTION##&checkpoint=##CHECKPOINT##&datapointdesc=##DPDESCRIPTION##&hostdesc=##HOSTDESCRIPTION##&hostinfo=##system.sysinfo##&hostips=##system.ips##&hosturl=##DEVICEURL##&instance=##INSTANCE##&dsidesc=##DSIDESCRIPTION##&batchdesc=##BJDESCRIPTION##&hostname=##system.hostname##&dsdesc=##DSDESCRIPTION##&eventmsg=##LIMITEDMESSAGE##&eventlogmsg=##MESSAGE##&eventcode=##EVENTCODE##&eventtype=##TYPE##&eventuser=##USER##&eventlogfile=##LOGFILE##&servicedetail=##DETAIL##&serviceurl=##URL##&servicegroup=##SERVICEGROUP##&date=##DATE##&clearvalue=##CLEARVALUE##&internalid=##INTERNALID##&alerturl=##ALERTDETAILURL##&CustomVariable1Name=##Name##&CustomVariable1Value=##Value##&CustomVariable2Name=##Name##&CustomVariable2Value=##Value##
Note: Custom User Defined Incident Message
Users can define custom Incident Message within Alert Data. The variable can be added in the format mentioned below :
&CustomIncidentMessage=##IncidentMessage##
Replace the ##IncidentMessage## with proper values and add at the end of the variables mentioned in Step 4. This is how it would look like :
service=##SERVICE##&alertid=##ALERTID##&alerttype=##ALERTTYPE##&alertstatus=##ALERTSTATUS##&level=##LEVEL##&host=##HOST##&datasource=##DATASOURCE##&eventsource=##EVENTSOURCE##&batchjob=##BATCHJOB##&group=##GROUP##&datapoint=##DATAPOINT##&start=##START##&finish=##FINISH##&duration=##DURATION##&value=##VALUE##&threshold=##THRESHOLD##&userdata=##USERDATA##&cmdline=##CMDLINE##&exitCode=##EXITCODE##&stdout=##STDOUT##&stderr=##STDERR##&agent=##AGENT_DESCRIPTION##&checkpoint=##CHECKPOINT##&datapointdesc=##DPDESCRIPTION##&hostdesc=##HOSTDESCRIPTION##&hostinfo=##system.sysinfo##&hostips=##system.ips##&hosturl=##DEVICEURL##&instance=##INSTANCE##&dsidesc=##DSIDESCRIPTION##&batchdesc=##BJDESCRIPTION##&hostname=##system.hostname##&dsdesc=##DSDESCRIPTION##&eventmsg=##LIMITEDMESSAGE##&eventlogmsg=##MESSAGE##&eventcode=##EVENTCODE##&eventtype=##TYPE##&eventuser=##USER##&eventlogfile=##LOGFILE##&servicedetail=##DETAIL##&serviceurl=##URL##&servicegroup=##SERVICEGROUP##&date=##DATE##&clearvalue=##CLEARVALUE##&internalid=##INTERNALID##&alerturl=##ALERTDETAILURL##&CustomVariable1Name=##Name##&CustomVariable1Value=##Value##&CustomVariable2Name=##Name##&CustomVariable2Value=##Value##&CustomIncidentMessage=##IncidentMessage##
Enable Raw. Additionally, from the Format drop-down, select Form Data
- Do not enable the checkbox for Include an ID provided in HTTP response when updating alert status
(5) Click on Test Alert Delivery. This is will send a Test alert to Squadcast, triggering a Test incident. Verify this to ensure the integration is working as expected
(6) Save the integration configuration
Find more details on how each of these parameters for Custom HTTP Endpoints can be configured here
(7) Select Escalation Chains from the sidebar. Either Add a new Escalation Chain or edit an existing one
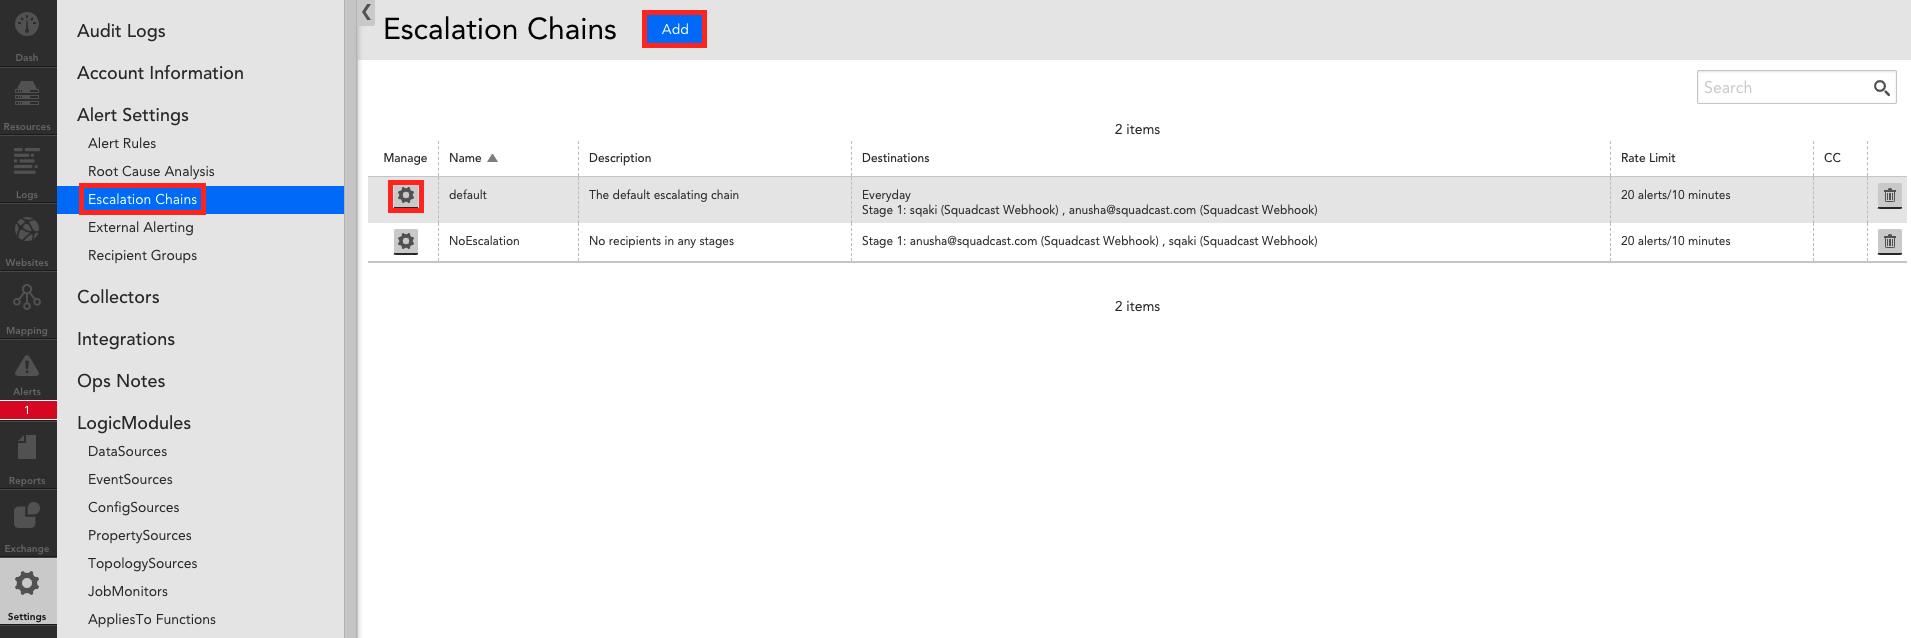
(8) Configure the Squadcast Webhook within your Escalation Chain and Save it
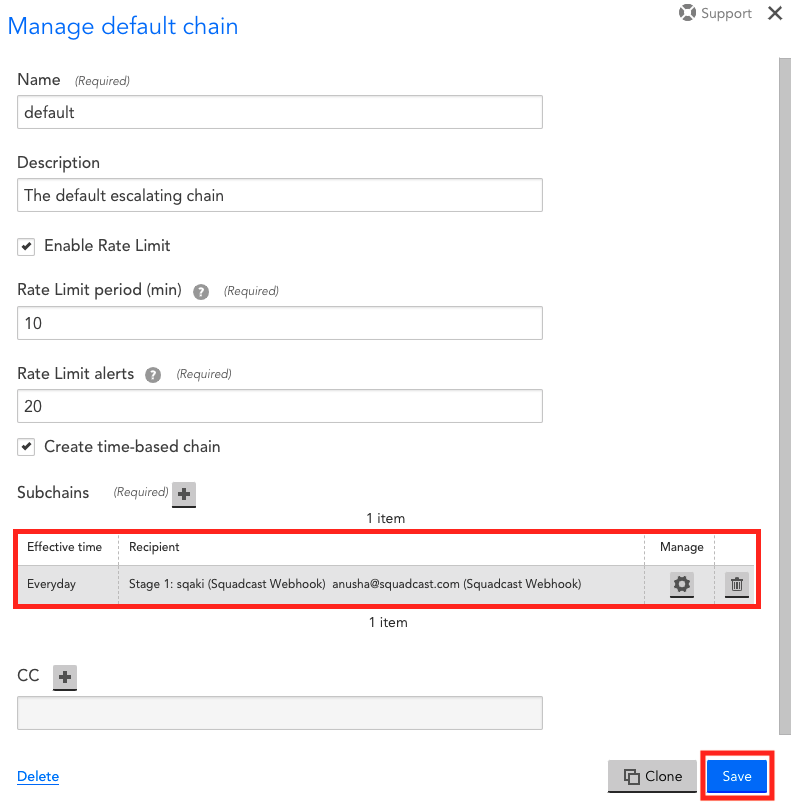
Find more details on how each of these parameters for Escalation Chains can be configured here
(9) Select Alert Rules from the sidebar from under Alert Settings. Either Add a new Alert Rule or edit an existing one

(10) Fill in all the relevant details. Enable the checkbox Send notification when alerts clear. Choose the configured Escalation Chain from the drop-down and Save it
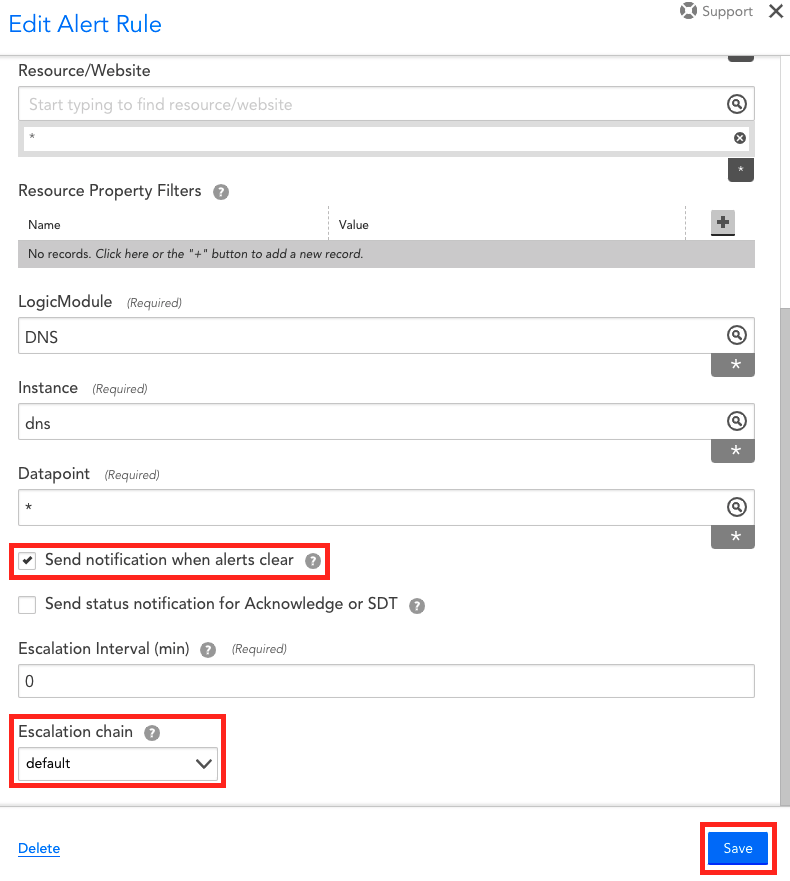
Find more details on how each of these parameters for Alert Rules can be configured here
That is it, you are now good to go! Whenever an alert is triggered in LogicMonitor, an incident will be created automatically in Squadcast.
Q: If an alert gets resolved in LogicMonitor, does LogicMonitor send auto-resolve signals to Squadcast?
A: Yes, LogicMonitor sends auto-resolve signals to Squadcast.