Grafana 8
This document will help you integrate Grafana 8 with Squadcast.
Grafana is a data visualization platform that allows you to query, visualize and alert on metrics no matter where they are stored.
Route detailed alerts from Grafana 8 to the right users in Squadcast.
How to integrate Grafana 8 with Squadcast
In Squadcast: Using Grafana 8 as an Alert Source
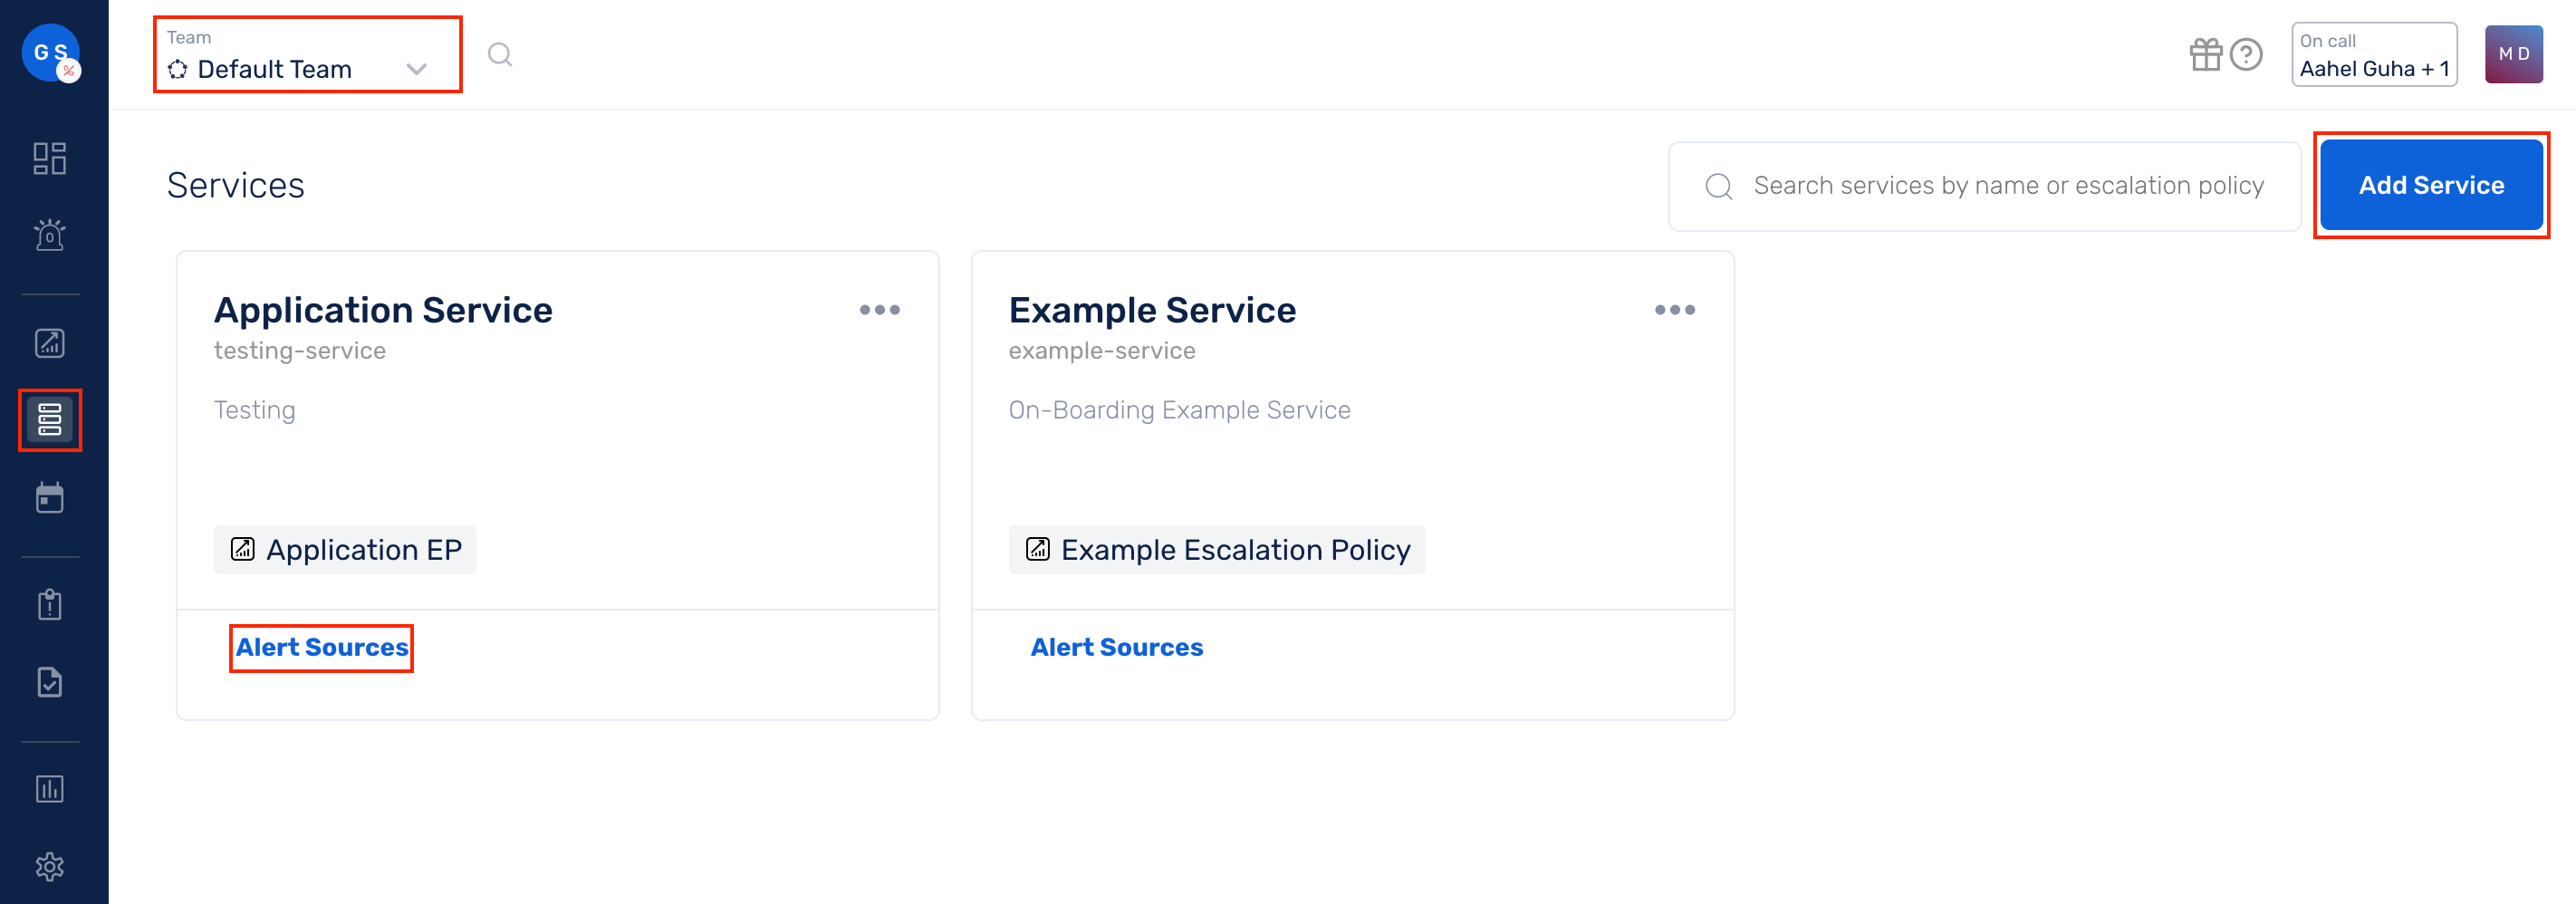
(1) From the navigation bar on the left, select Services. Pick the applicable Team from the Team-picker on the top. Next, click on Alert Sources for the applicable Service
(2) Search for Grafana 8 from the Alert Source drop-down and copy the Webhook URL
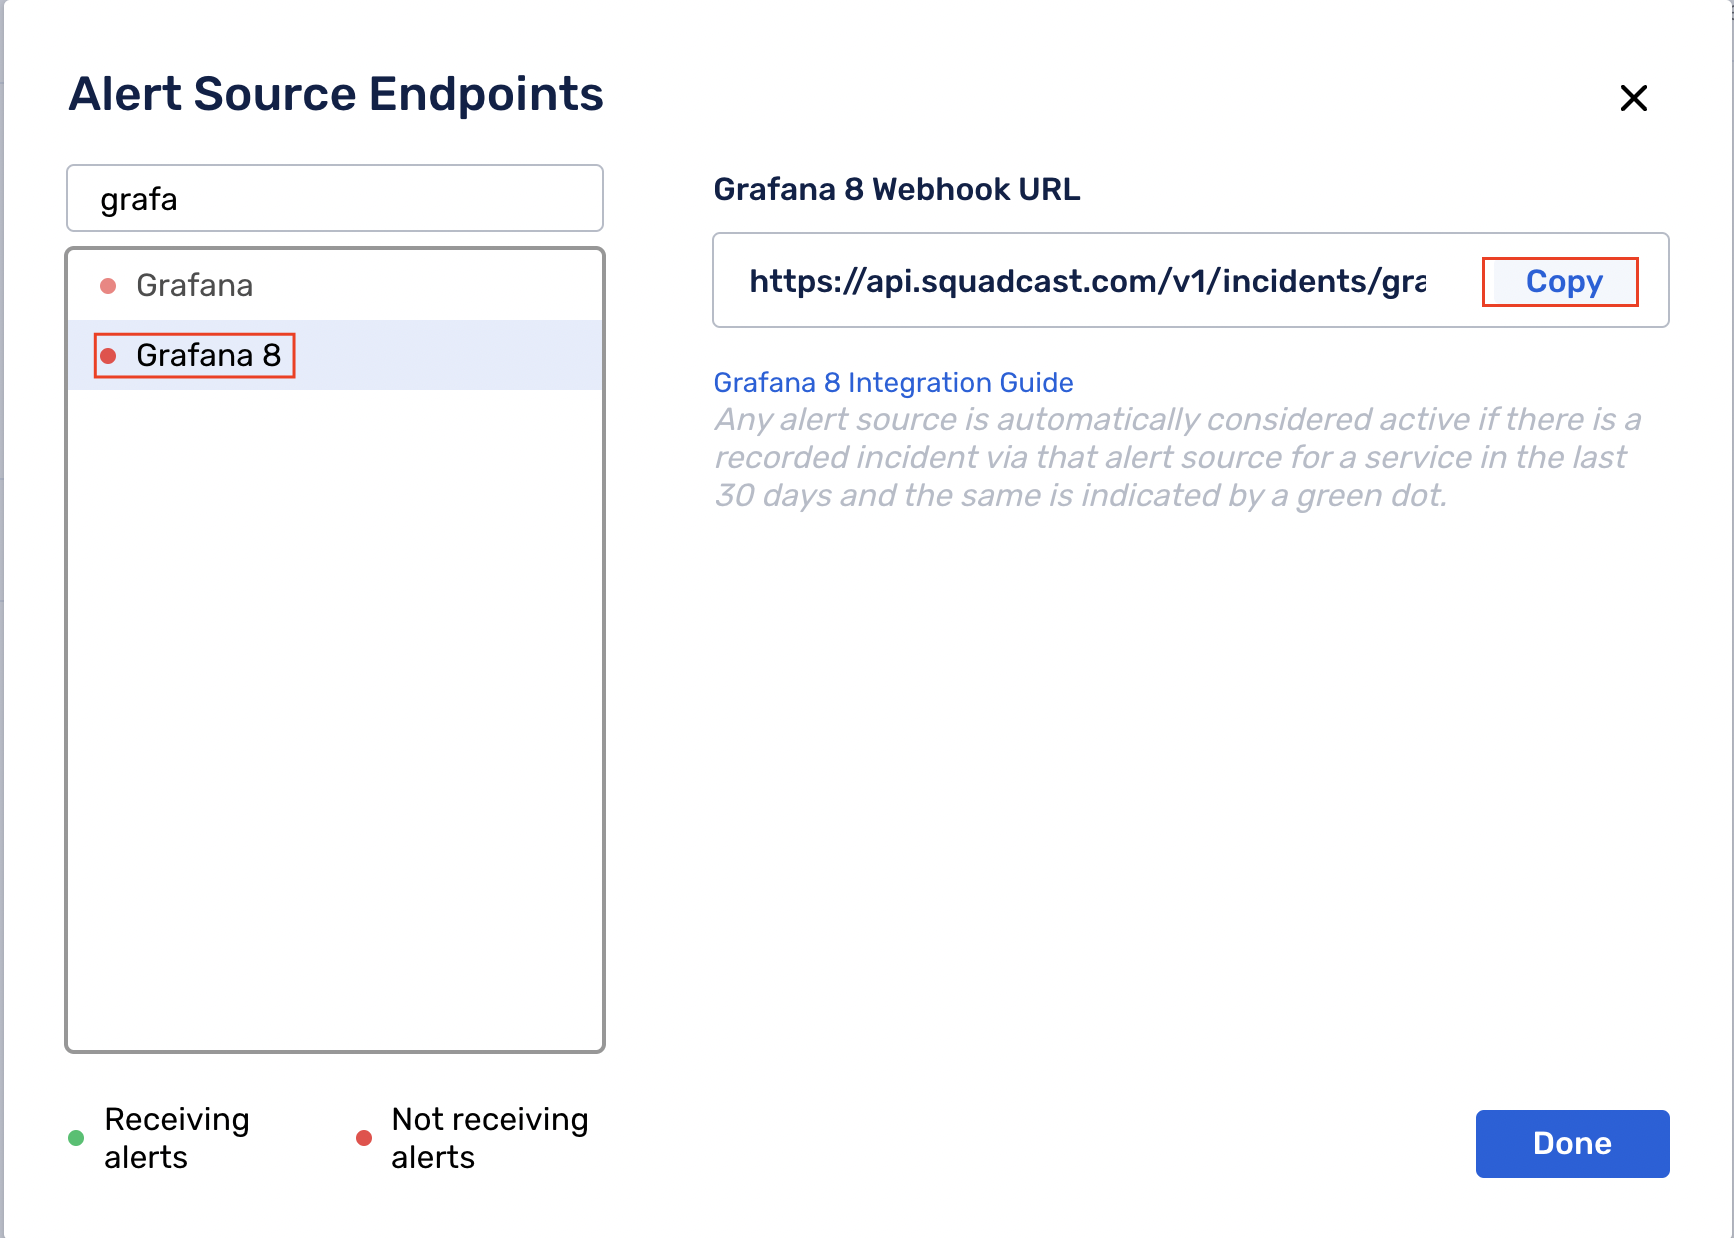
For an Alert Source to turn active (indicated by a green dot - Receiving alerts against the name of the Alert Source in the drop-down), you can either generate a test alert or wait for a real-time alert to be generated by the Alert Source.
An Alert Source is active if there is a recorded incident via that Alert Source for the Service in the last 30 days.
In Grafana 8: Create a Squadcast Webhook as a Notification Channel
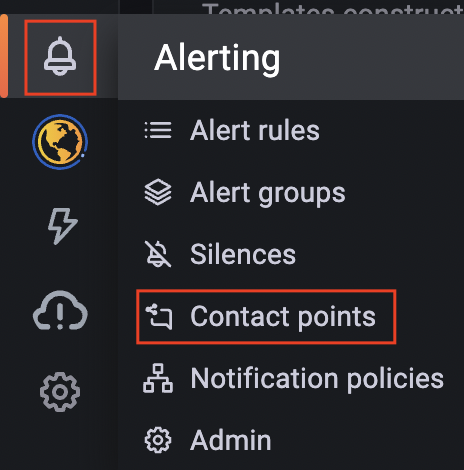
(1) Login to your Grafana 8 dashboard, click on the Alerting (Bell) icon and select Contact points
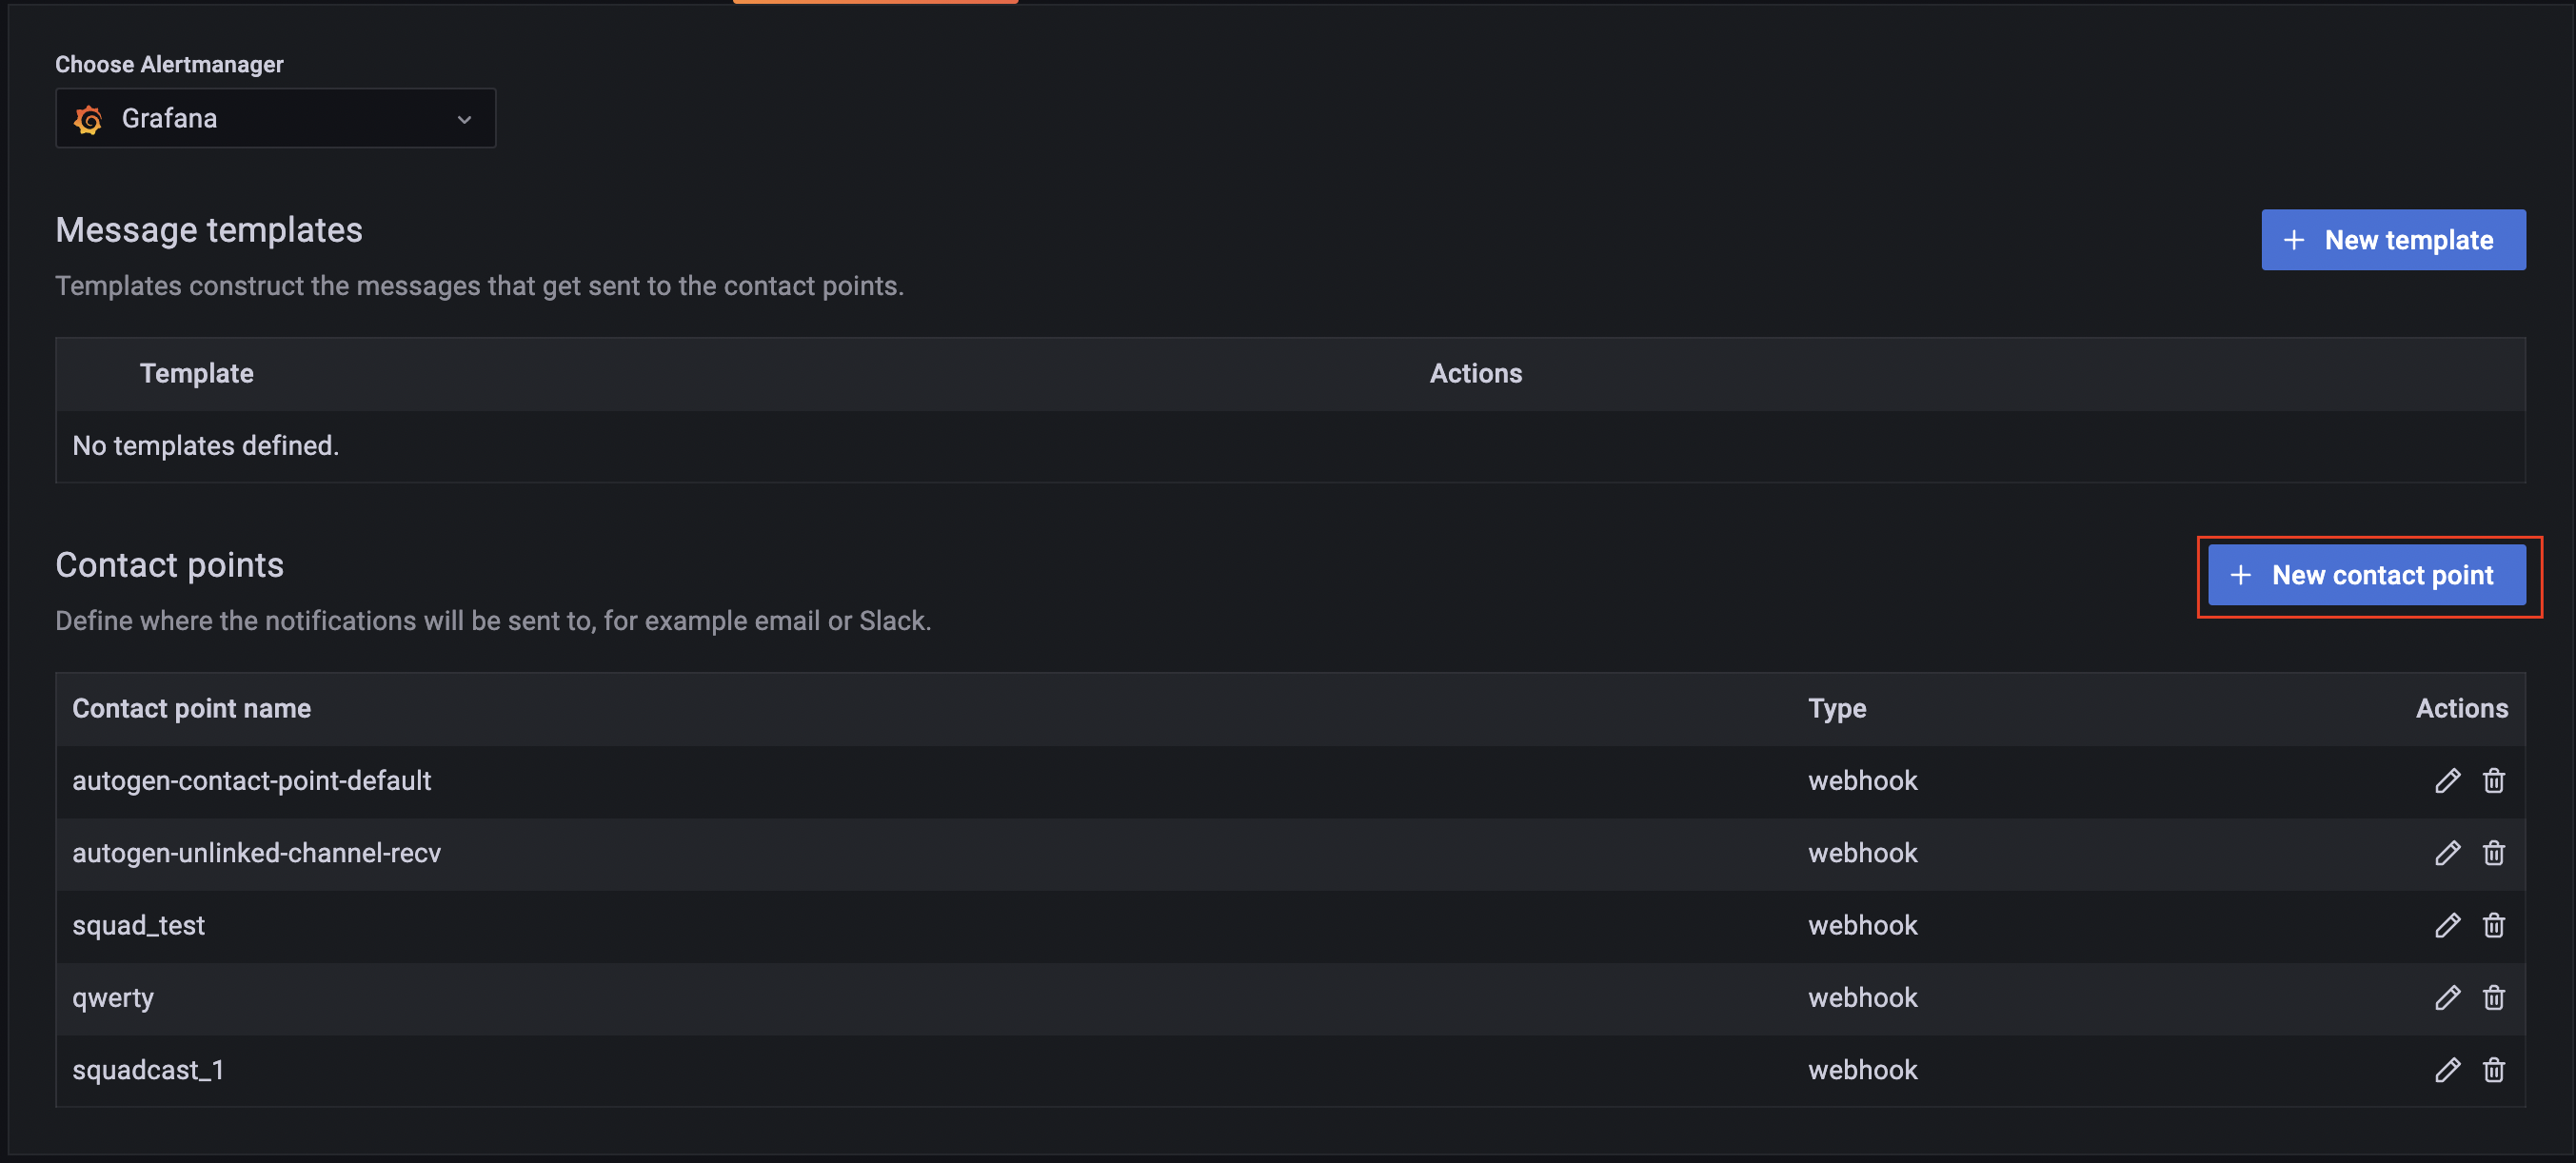
(2) Click on New contact point
(3) Enter Name as Squadcast, under Contact point type- select Webhook and under URL, paste the previously copied Webhook URL from Squadcast
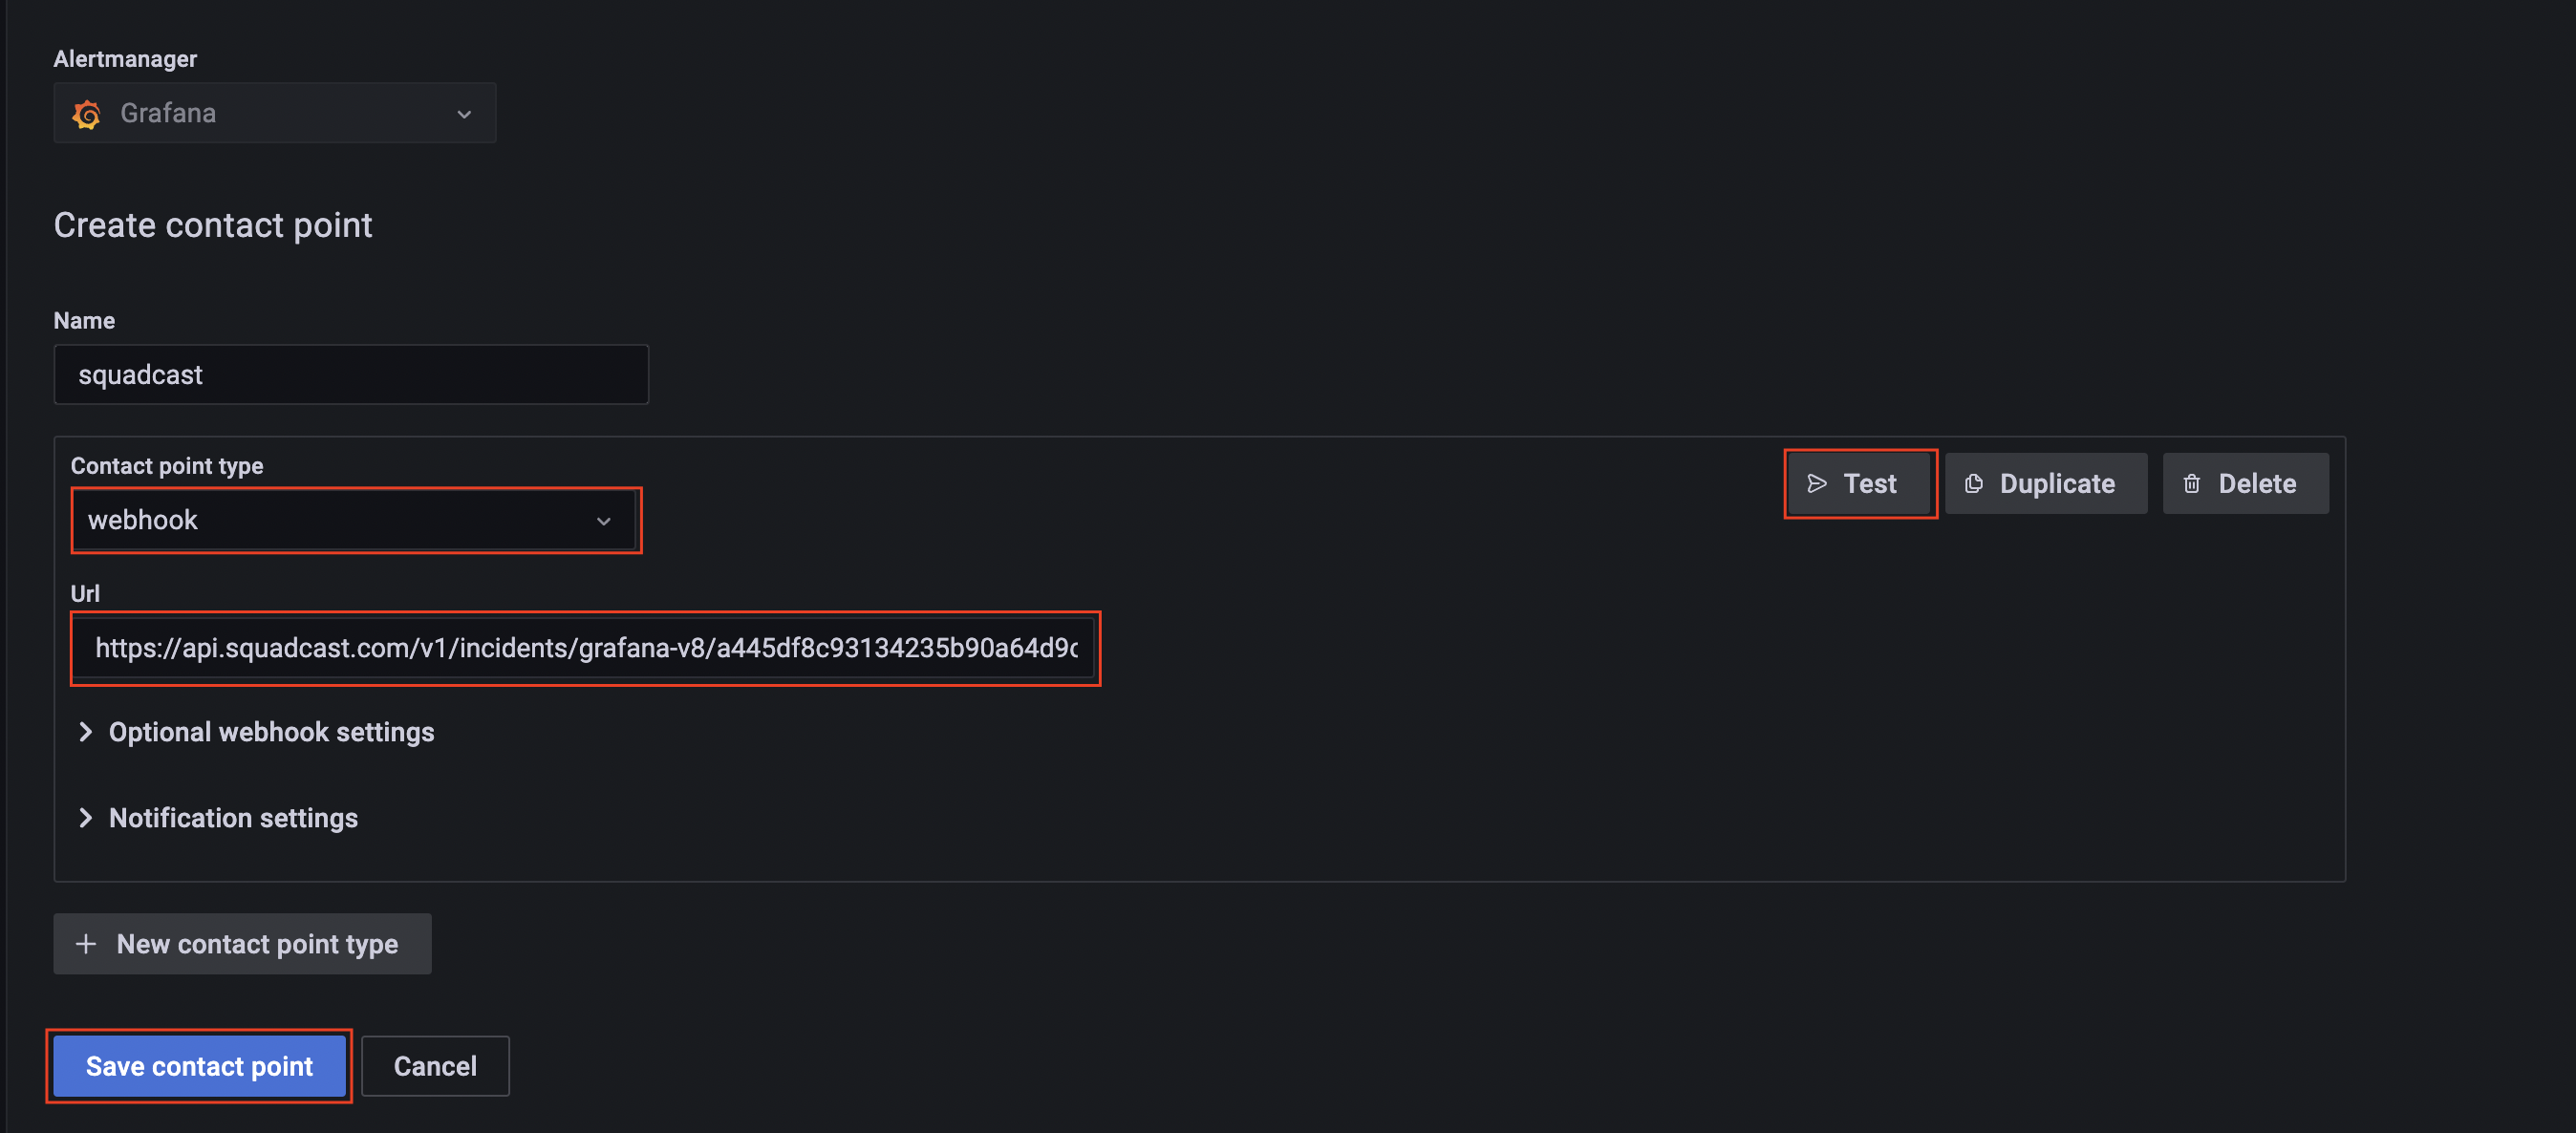
(4) Click on Save to enable the integration. You can test the integration by clicking on Test. This will trigger a test incident in Squadcast
Now, whenever an alert is triggered in Grafana 8, an incident will be created in Squadcast. When an alert is resolved in Grafana 8, the corresponding incident will automatically get resolved in Squadcast, provided the Disable Resolve Message checkbox is unchecked.