PRTG Network Monitor
This document will help you integrate PRTG Network Monitor with Squadcast.
PRTG Network Monitor by Paessler is a tool used to monitor small and midsize infrastructures. It provides maps and dashboards, flexible alerting, multiple user interfaces and distributed monitoring.
Route detailed alerts from PRTG Network Monitor to the right users in Squadcast.
Using PRTG Network Monitor as an Alert Source
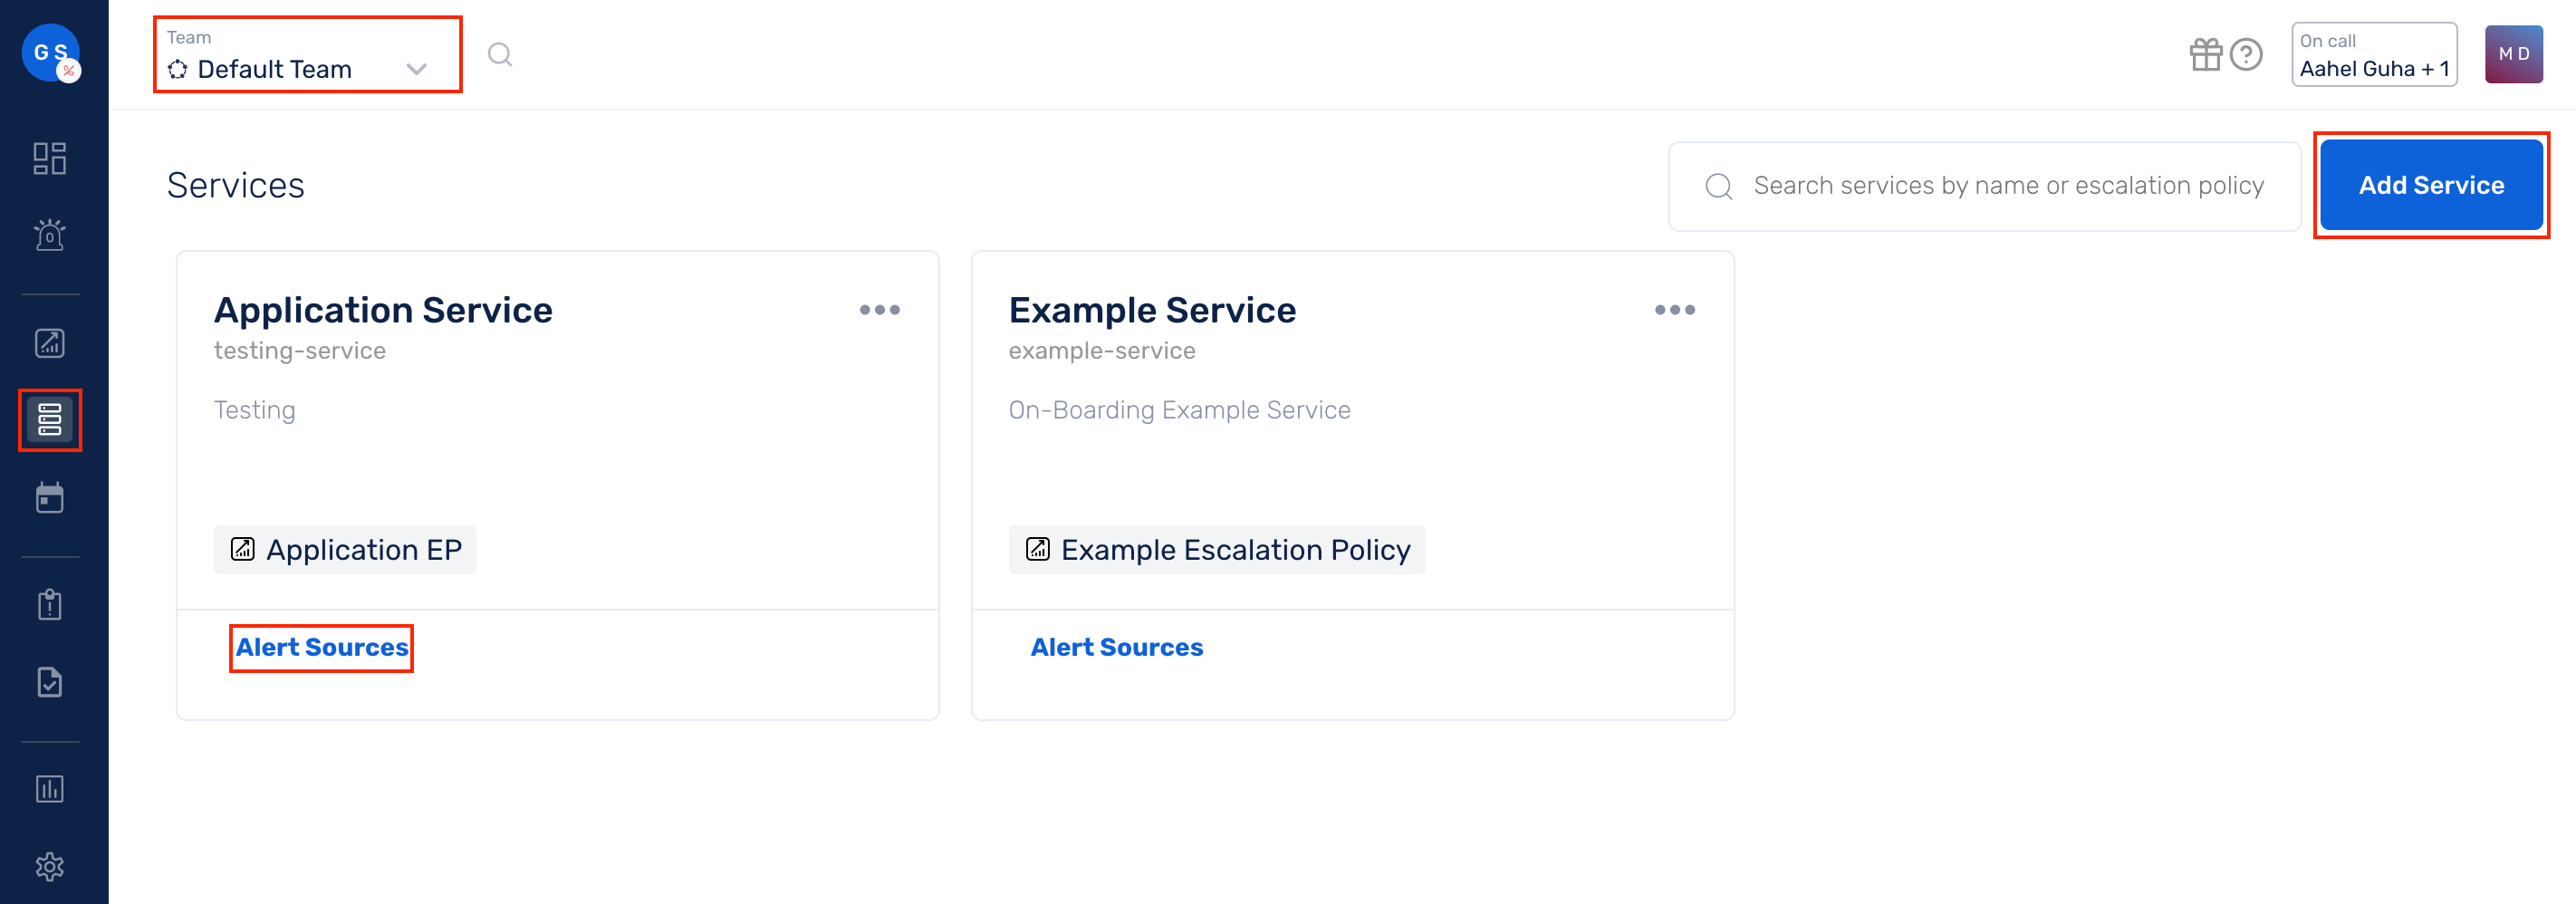
(1) From the navigation bar on the left, select Services. Pick the applicable Team from the Team-picker on the top. Next, click on Alert Sources for the applicable Service
(2) Search for PRTG Network Monitor from the Alert Source drop-down and copy the Webhook URL
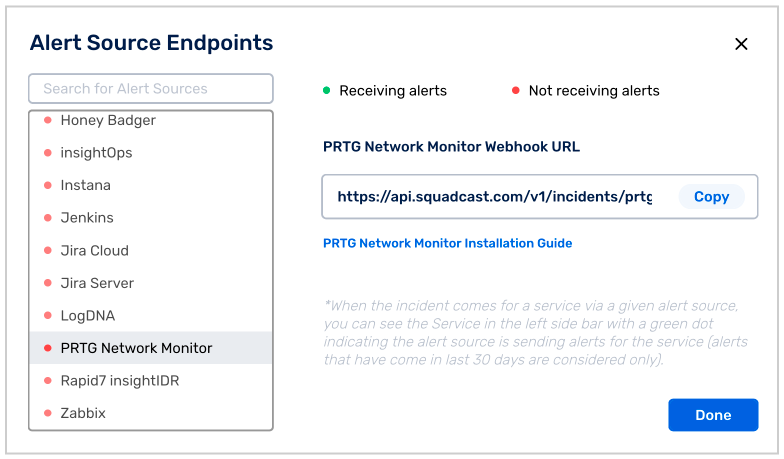
For an Alert Source to turn active (indicated by a green dot - Receiving alerts against the name of the Alert Source in the drop-down), you can either generate a test alert or wait for a real-time alert to be generated by the Alert Source.
An Alert Source is active if there is a recorded incident via that Alert Source for the Service in the last 30 days.
Create a Squadcast Webhook in PRTG Network Monitor
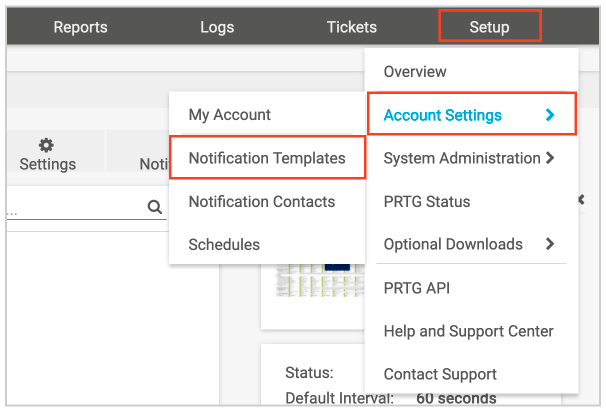
(1) Login to your PRTG Network Monitor dashboard. Go to Setup present in the top right corner of the screen. Select Account Settings –> Notification Templates
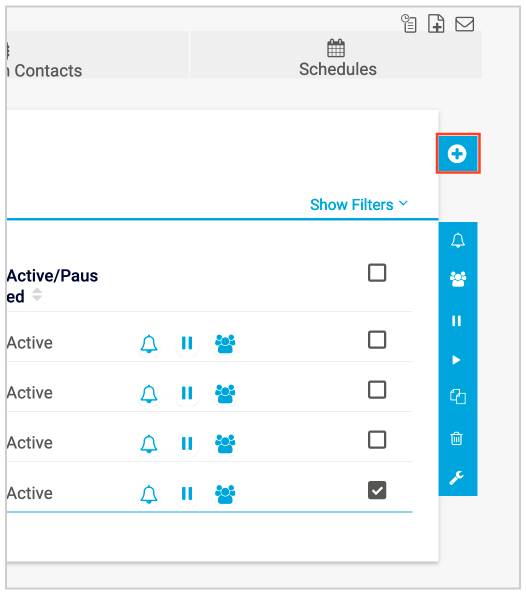
(2) Click on the + button on the right side of the screen to Add Notification Template
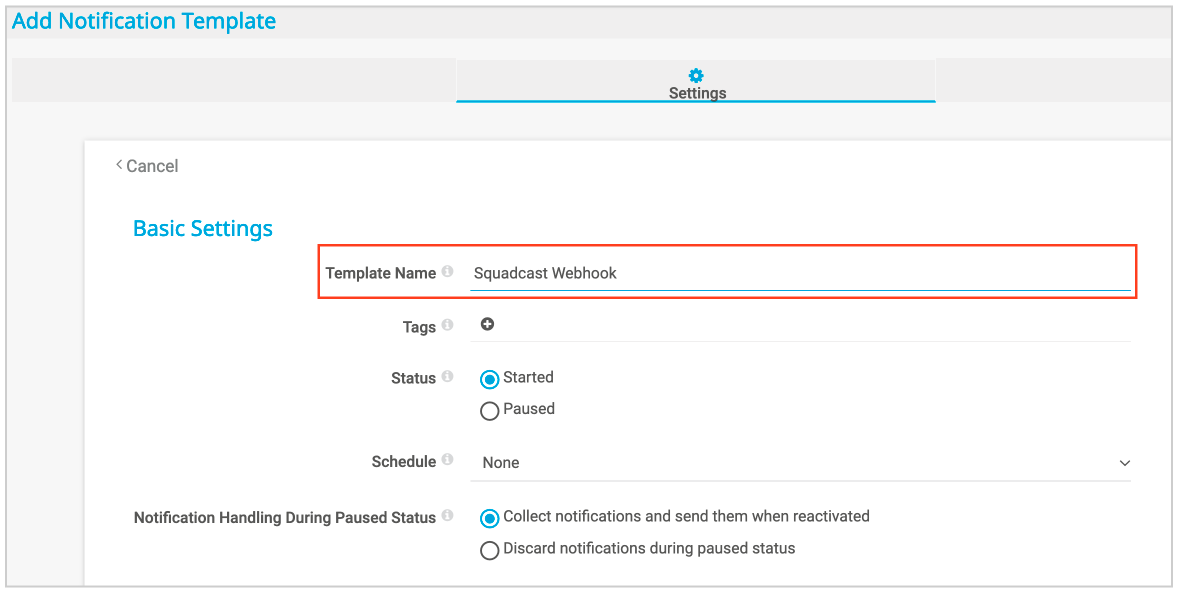
(3) Name it Squadcast Webhook for easy identification. Configure the remaining fields as per your requirements
(4) Scroll down and tick the Execute HTTP Action button. Paste the webhook URL copied from Squadcast platform in the URL field
Select HTTP Method as POST and paste the snippet given below in the payload field.
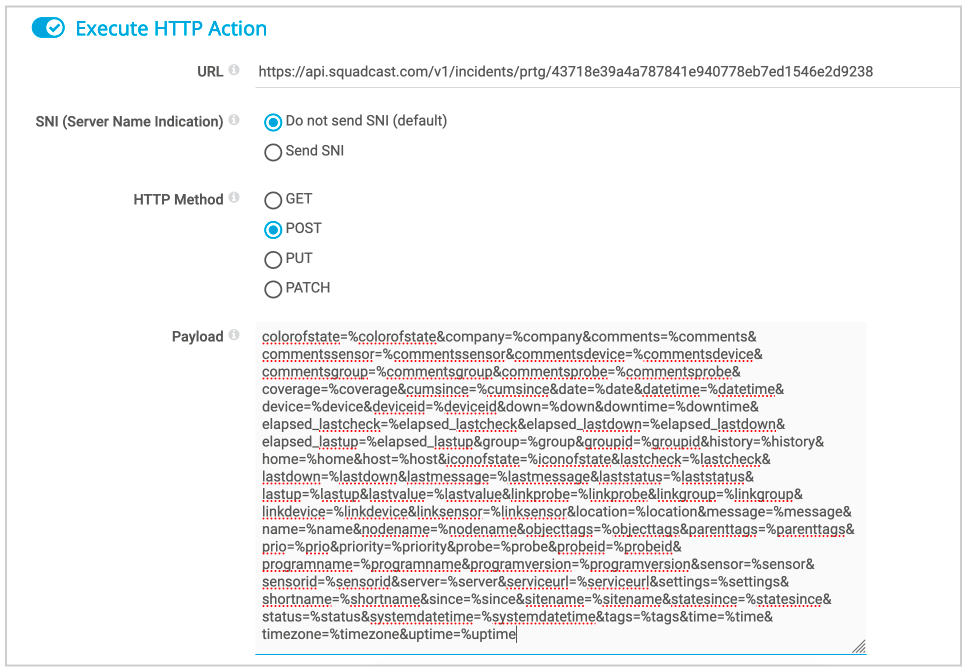
colorofstate=%colorofstate&company=%company&comments=%comments&commentssensor=%commentssensor&commentsdevice=%commentsdevice&commentsgroup=%commentsgroup&commentsprobe=%commentsprobe&coverage=%coverage&cumsince=%cumsince&date=%date&datetime=%datetime&device=%device&deviceid=%deviceid&down=%down&downtime=%downtime&elapsed_lastcheck=%elapsed_lastcheck&elapsed_lastdown=%elapsed_lastdown&elapsed_lastup=%elapsed_lastup&group=%group&groupid=%groupid&history=%history&home=%home&host=%host&iconofstate=%iconofstate&lastcheck=%lastcheck&lastdown=%lastdown&lastmessage=%lastmessage&laststatus=%laststatus&lastup=%lastup&lastvalue=%lastvalue&linkprobe=%linkprobe&linkgroup=%linkgroup&linkdevice=%linkdevice&linksensor=%linksensor&location=%location&message=%message&name=%name&nodename=%nodename&objecttags=%objecttags&parenttags=%parenttags&prio=%prio&priority=%priority&probe=%probe&probeid=%probeid&programname=%programname&programversion=%programversion&sensor=%sensor&sensorid=%sensorid&server=%server&serviceurl=%serviceurl&settings=%settings&shortname=%shortname&since=%since&sitename=%sitename&statesince=%statesince&status=%status&systemdatetime=%systemdatetime&tags=%tags&time=%time&timezone=%timezone&uptime=%uptime
Note:
By default, the SNI field is set to Do not send SNI (default). Ideally, this setting should work fine. However, we have seen that certain users of PRTG Network Monitor receive SSL Handshake related errors. In such cases, you can simply change the setting here to Send SNI.
Then specify the app.squadcast.com as the SNI Name.
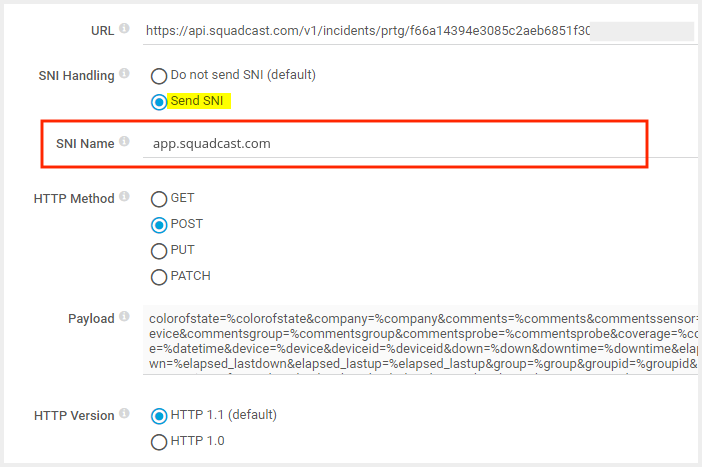
Doing so will solve for any SSL related errors that occur otherwise.
(5) Finally click on the Create button to create the Notification Template
Now, your Squadcast webhook is setup and ready to be consumed by sensors for sending alerts.
Simply select the Squadcast Webhook as the Notification Template from the dropdown when configuring Notification Triggers in order to send notifications to Squadcast.

That is it, you are good to go! Everytime an alert is generated in PRTG Network Monitor, an incident for it would be triggered in Squadcast. When the alert is resolved in PRTG Network Monitor (when the system gets back online), the corresponding incident for it will be automatically resolved in Squadcast.