Incident Dashboard
The Incident Dashboard is shown as soon as you log into the web application. This is the central console displaying all the incidents which have occurred for a team in the Organization along with their current status.
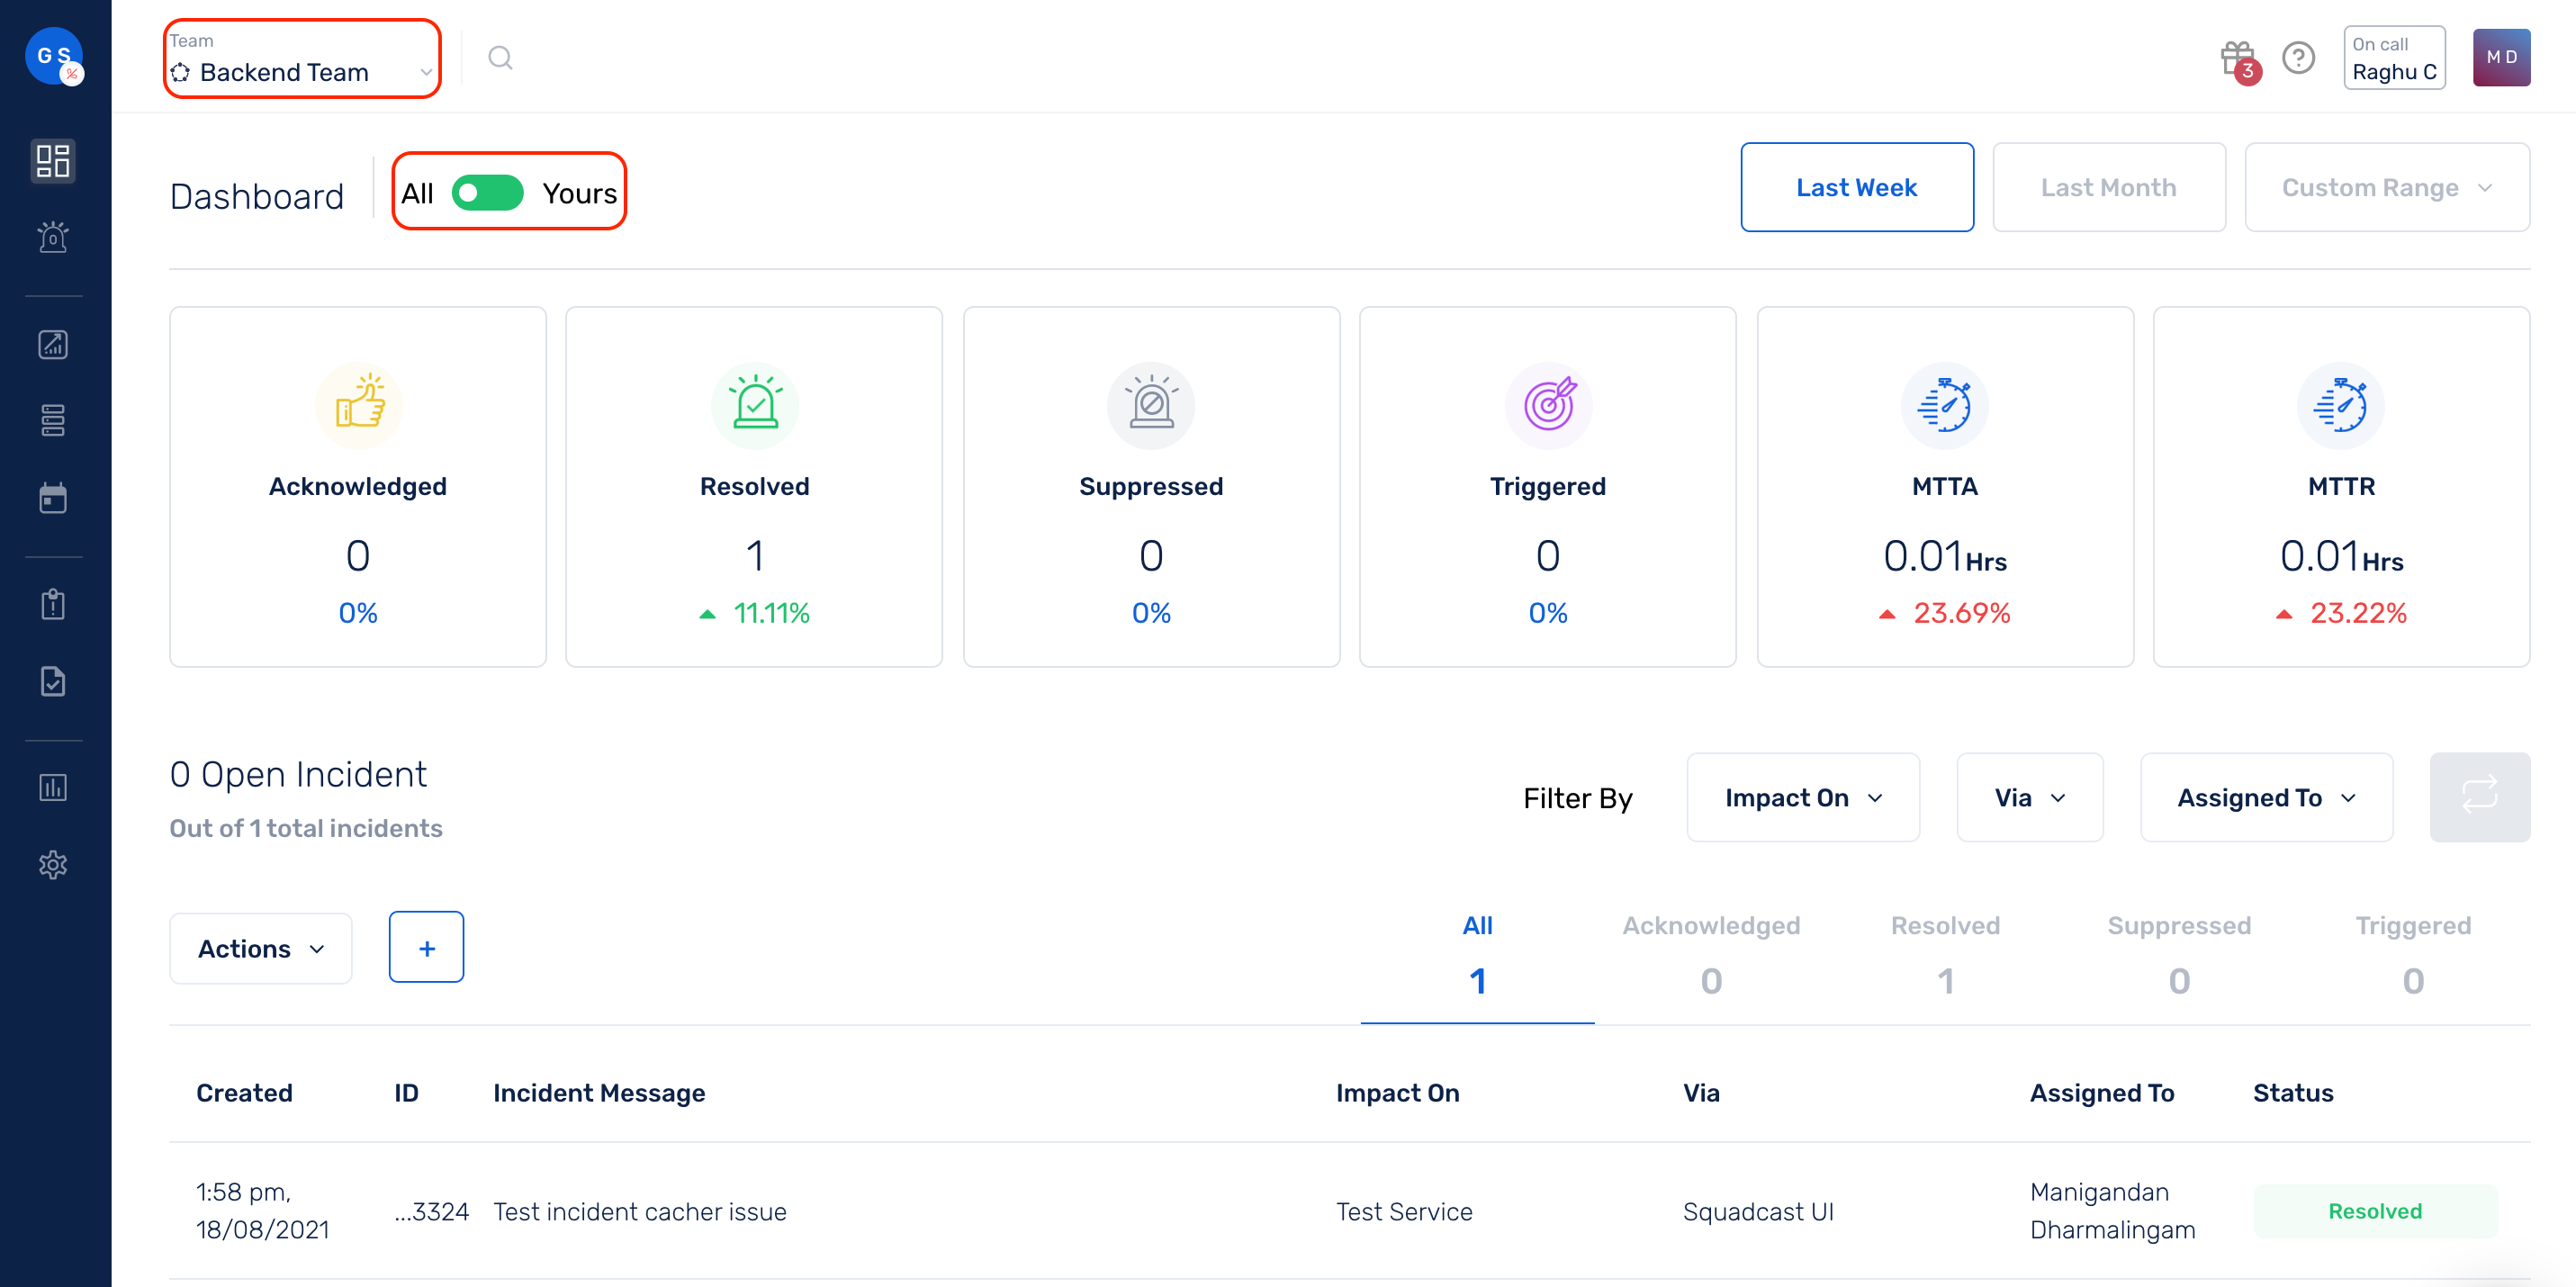
By default, all the incidents are displayed for the Team that is selected using the team picker on the top. You can switch the toggle to Yours to view incidents assigned to you in this Team.
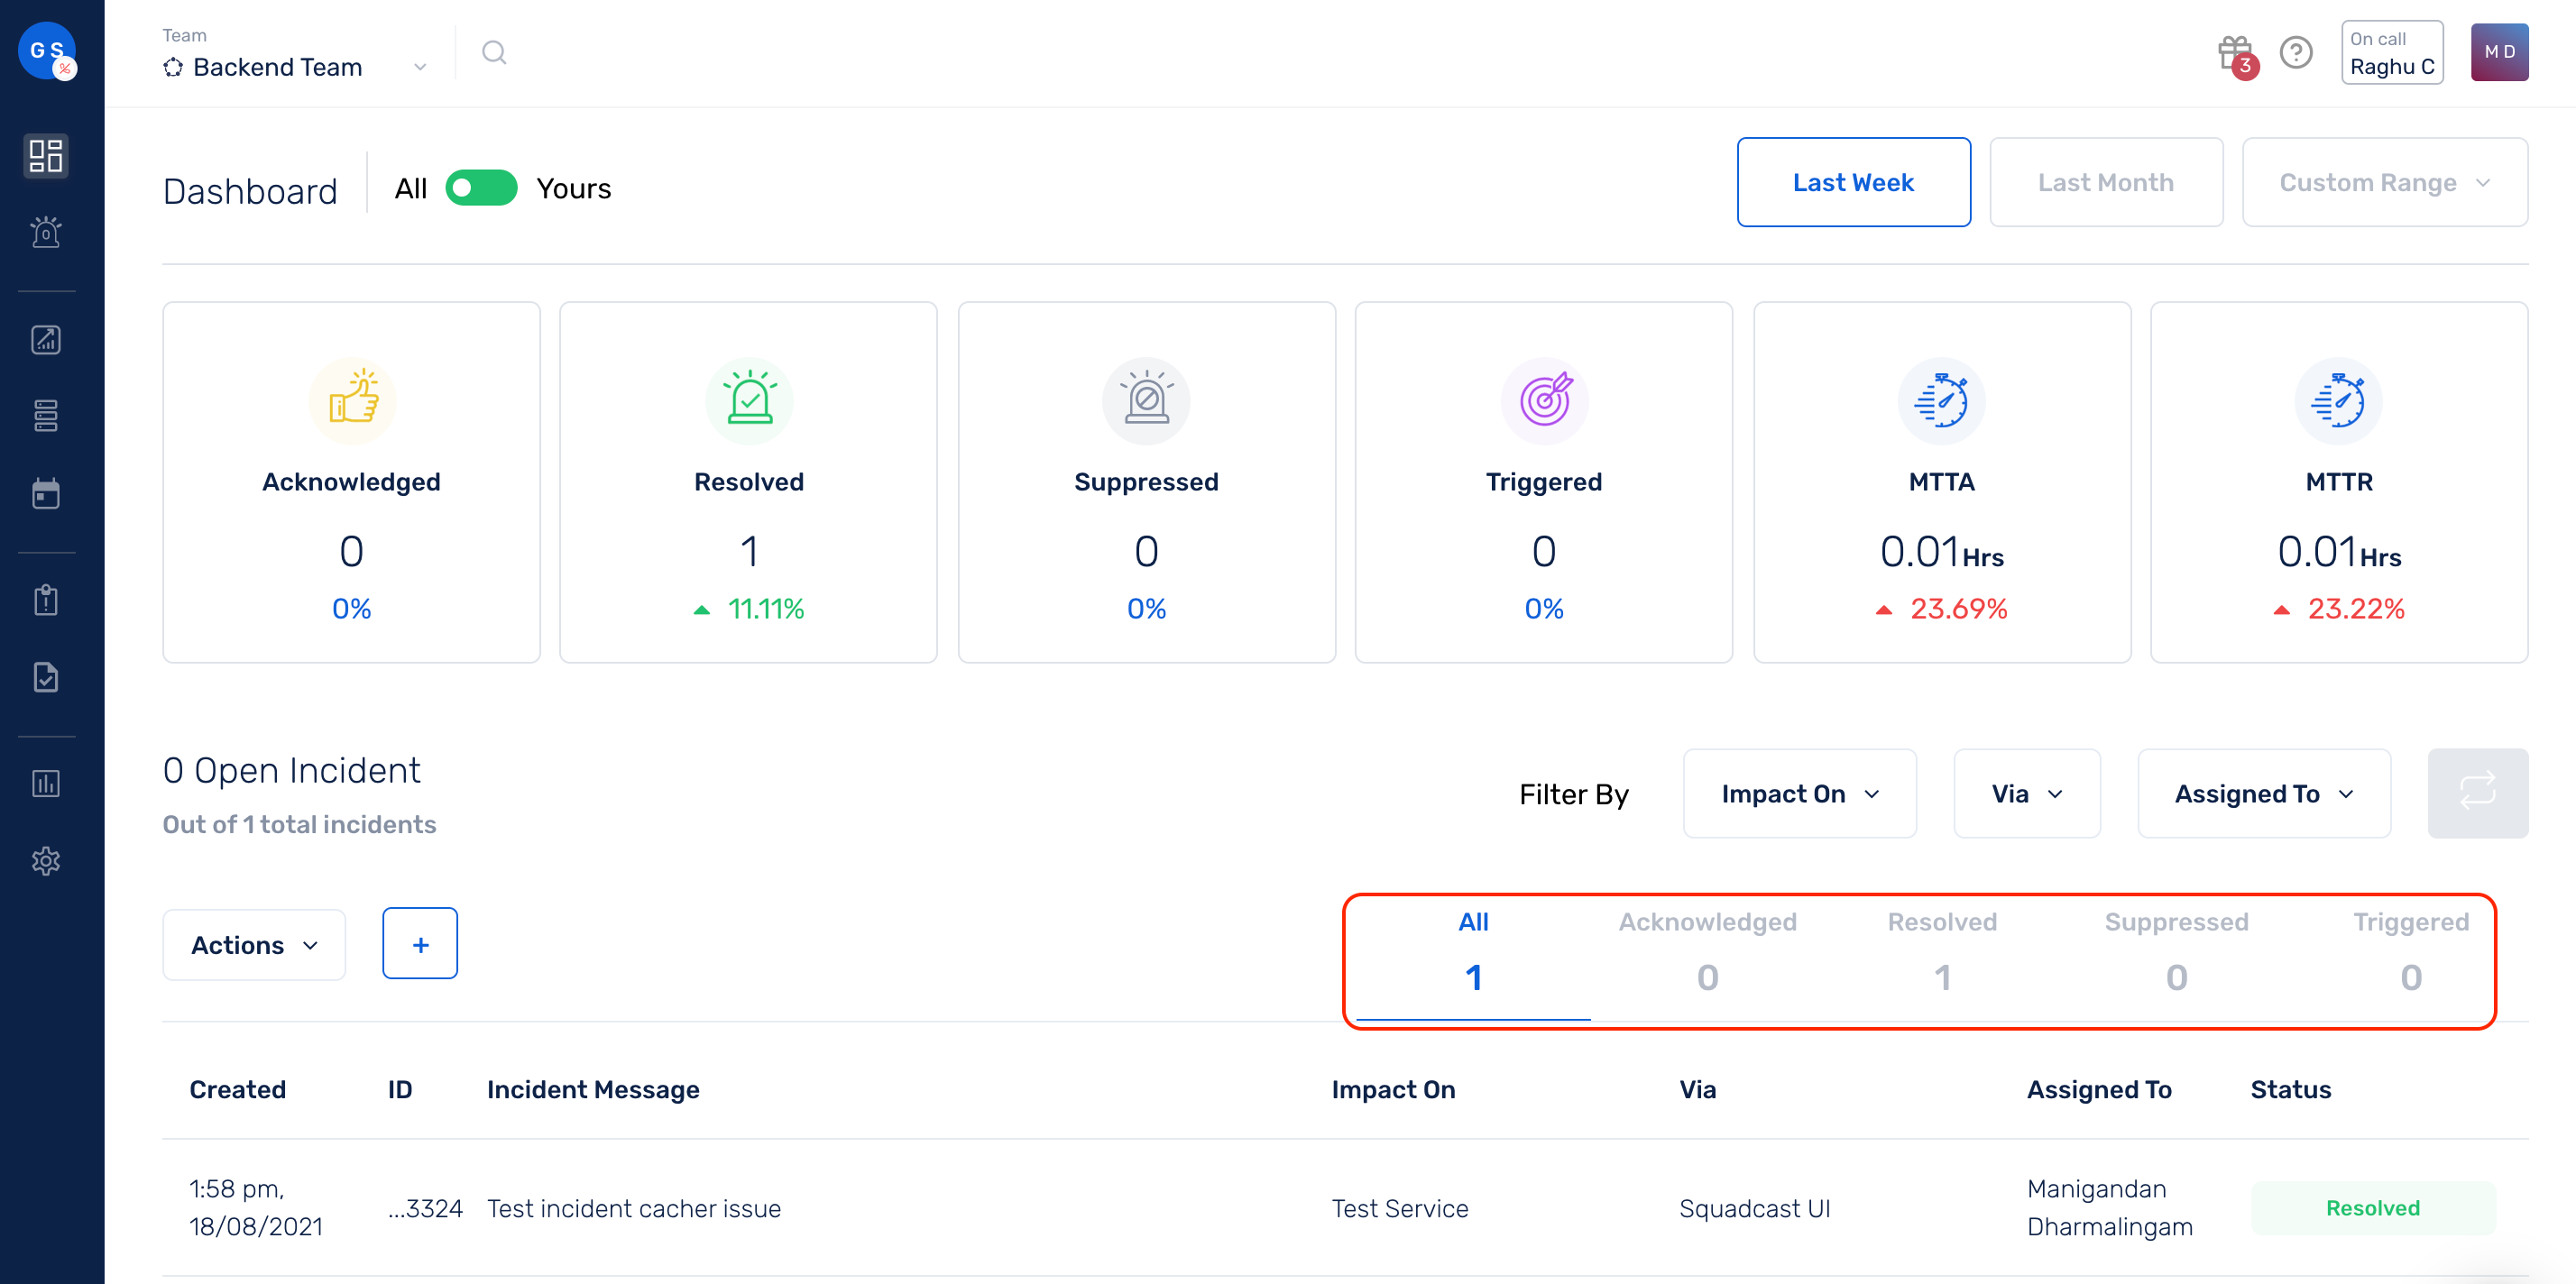
You can filter your incidents by their status (Triggered, Acknowledged, Resolved or Suppressed) by using the tab based navigation in the list section.
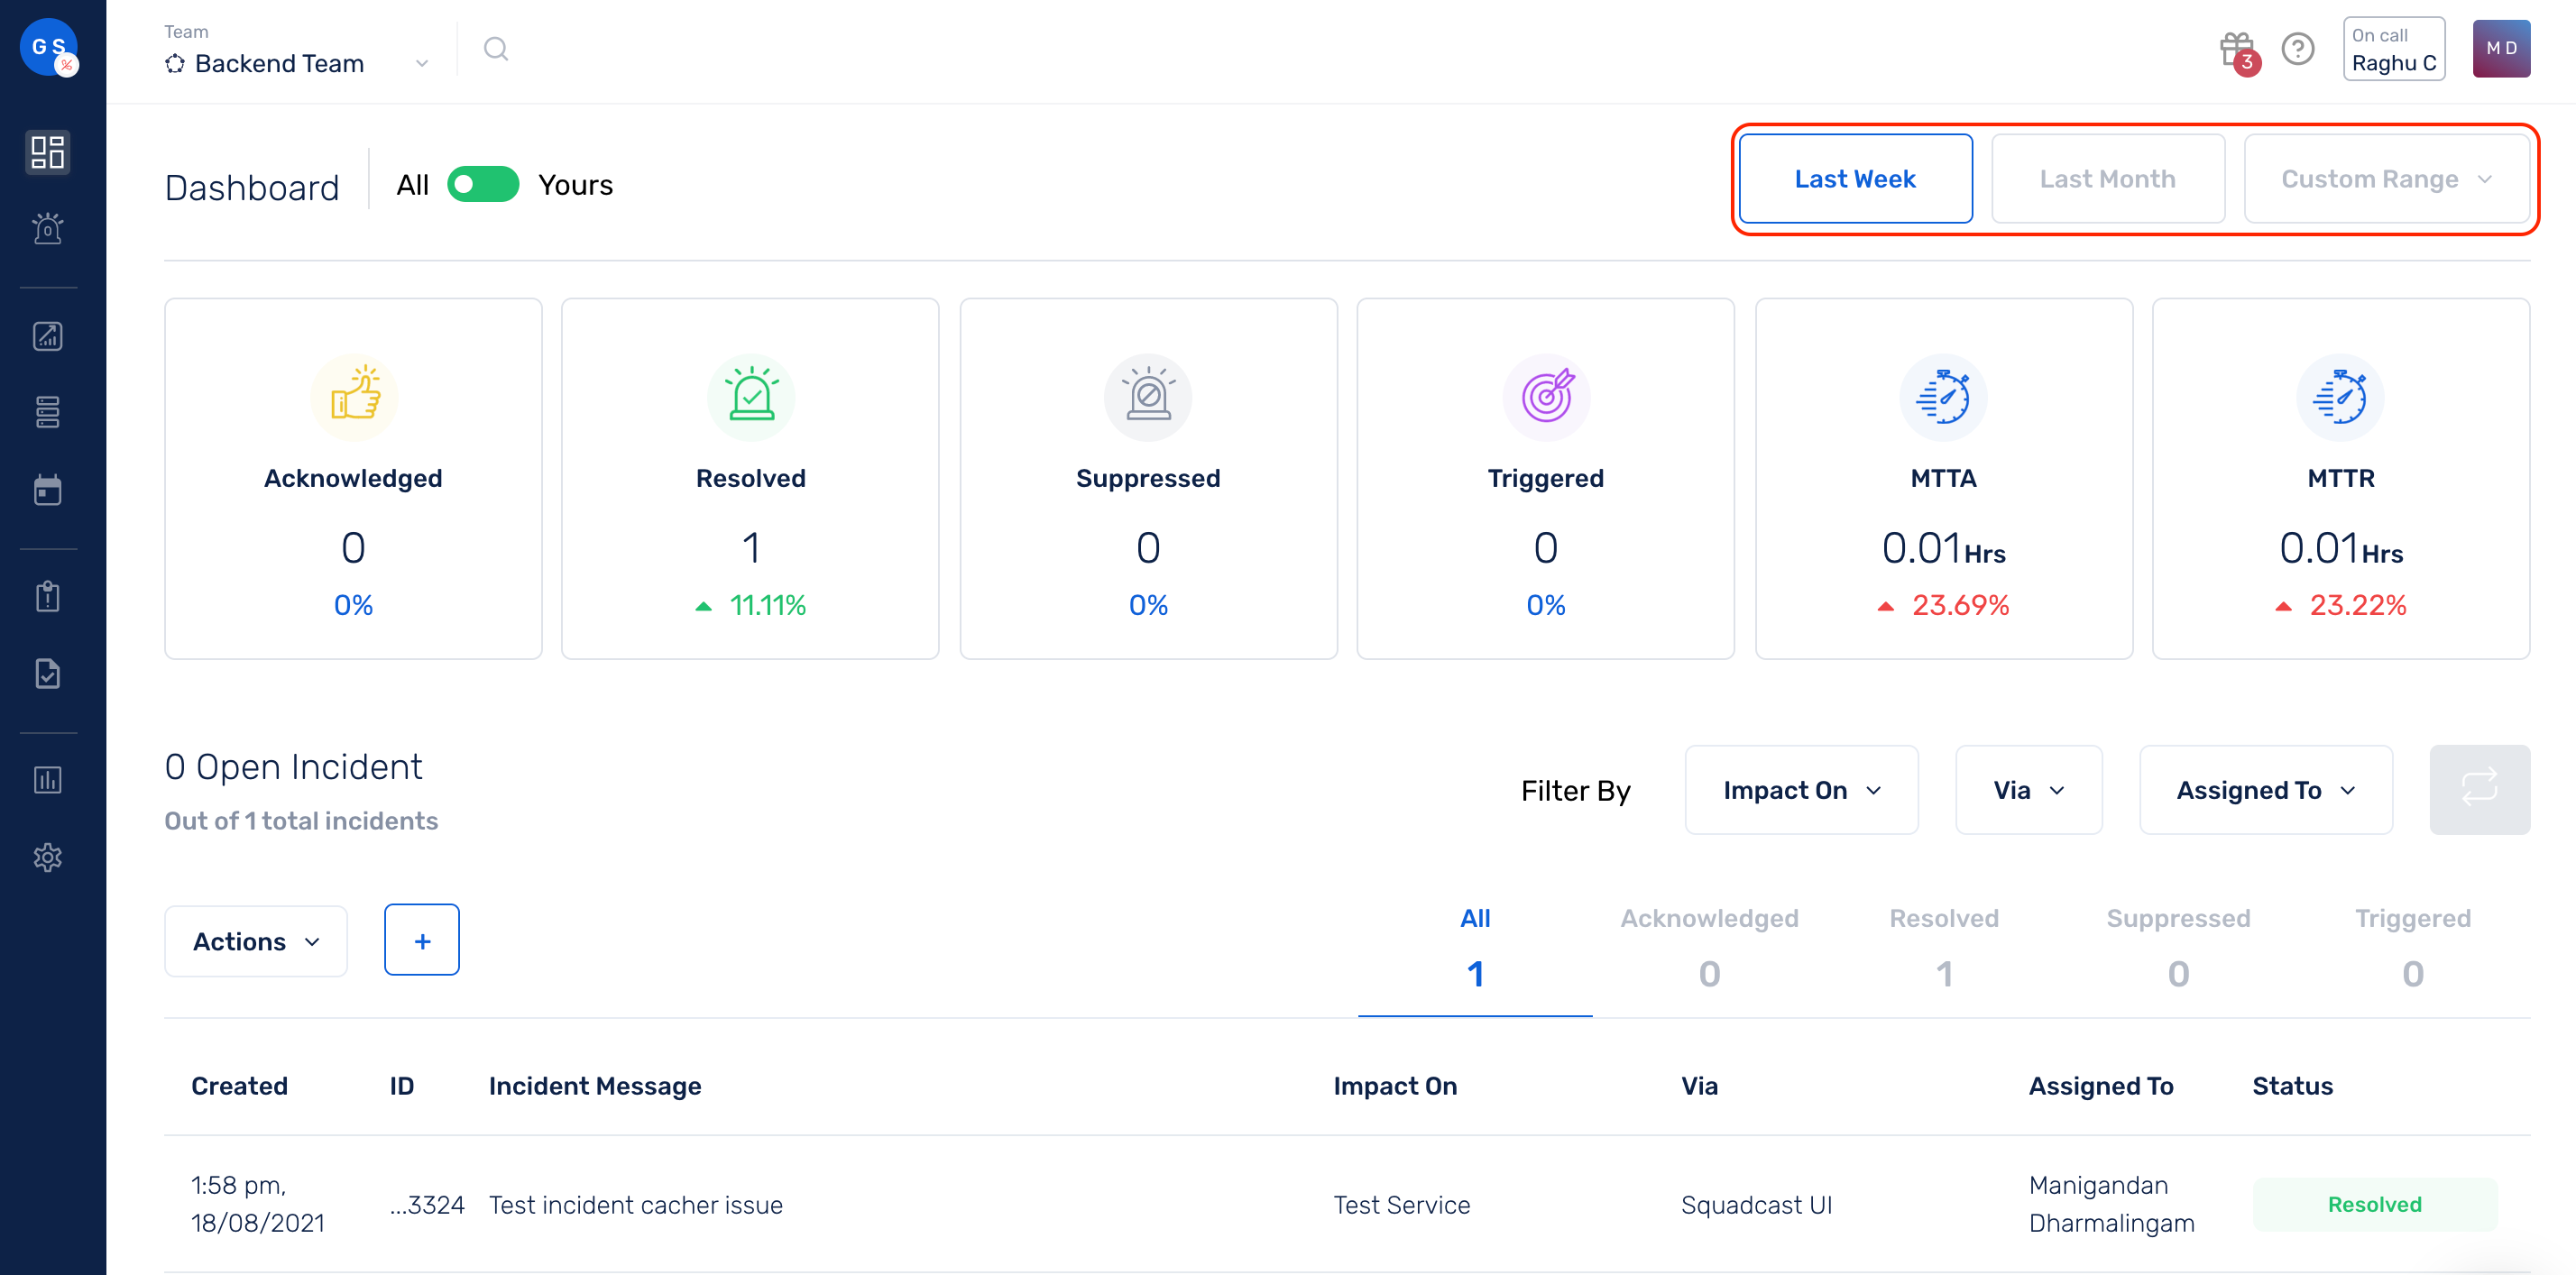
You can filter incidents by time using the quick filter options or by using the time range selector on the top right corner of the page. By default, incidents from the past week are displayed.
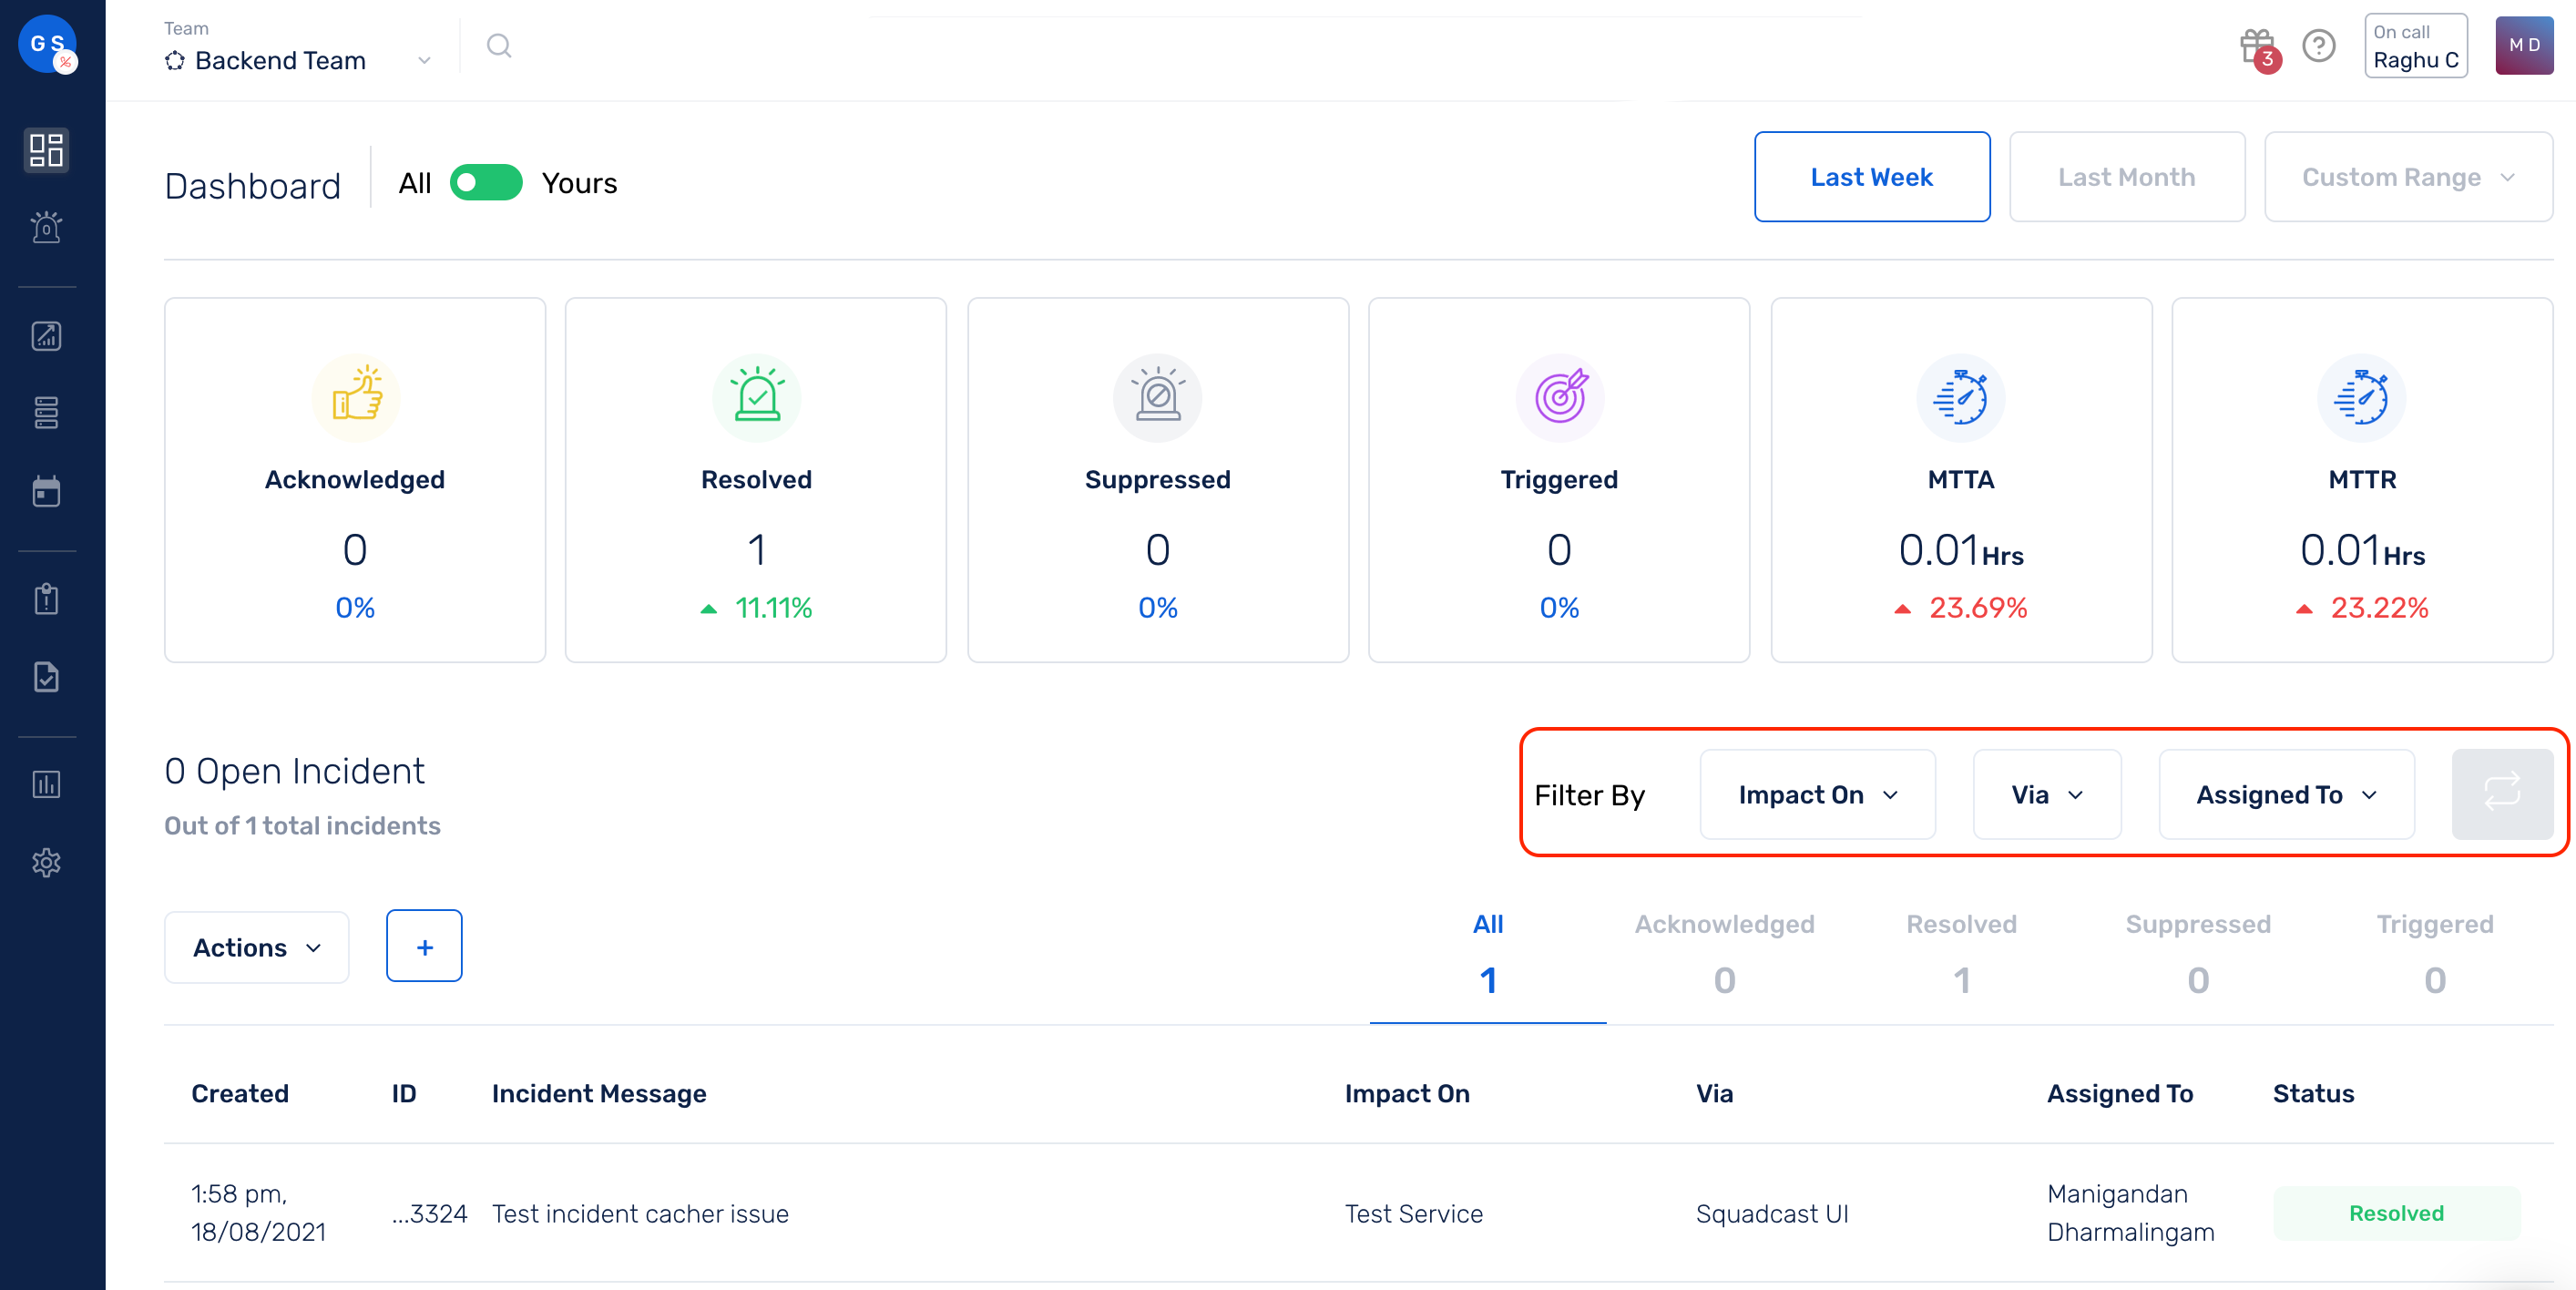
You can also filter incidents by the impacted Service, associated Alert Sources and Incident Assignees.